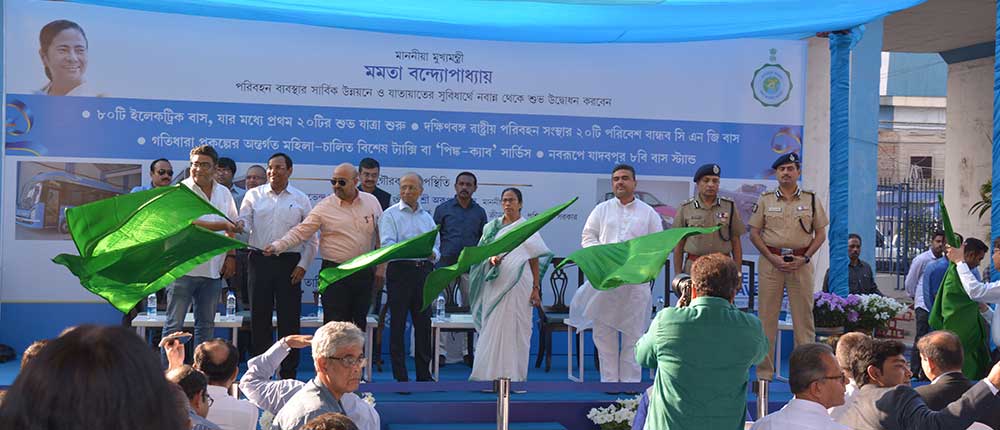
The IEA featured TERI's case study on Kolkata's successful operation of e-buses fleet in its flagship publication GEVO 2020
The city of Kolkata has a dense yet one of the most robust networks of public transportation – a combination of railways, rapid sub-urban Metrorail, trams, buses, three-wheelers, and ferries. There are 925 bus routes operating in the Kolkata Metropolitan Area (KMA), out of which 38% are being operated by state transport undertakings (STUs) while the remaining routes are operated by private operators. Kolkata has a well- established inter-state road connectivity network with other parts of the country through national and state highways (NH-2, 6, 34 & 117).
Air pollution from transport
Kolkata also has recorded the highest amount of particulate matter (PM) and Nitrogen Oxide (NOx) emissions per 0.1 million of vehicular population despite having fewer on-road vehicles than other metropolitan cities in the country. This is primarily due to operation of fleets of older vehicles. Road transport in the city contributes to almost 4.6 tonnes of PM per day.
The conventional diesel-based transport buses are observed to be the major contributors to air pollution (caused by PM, hydrocarbons and gases such as CO2, CO, SO2 & NOX) with 33% contribution to particulate matter emissions. Besides this, the monthly average values of PM2.5 and PM10, calculated on the basis of 24 hour mean values, are found to be a bit higher than the specified limits (greater than 60 and 100 μgg/m3 respectively) particularly in the period from October to March4. However, SO2 and NO2 are perceived to be well within the prescribed limits (<80 μg/m3)4. Additionally, the individual contribution from transport, industrial and domestic sectors is found to be 50%, 48% and 2% respectively as per previous studies. In 2019, the city's ambient air quality deteriorated during winter months and, in a few instances, was found to be more polluted than New Delhi's air.
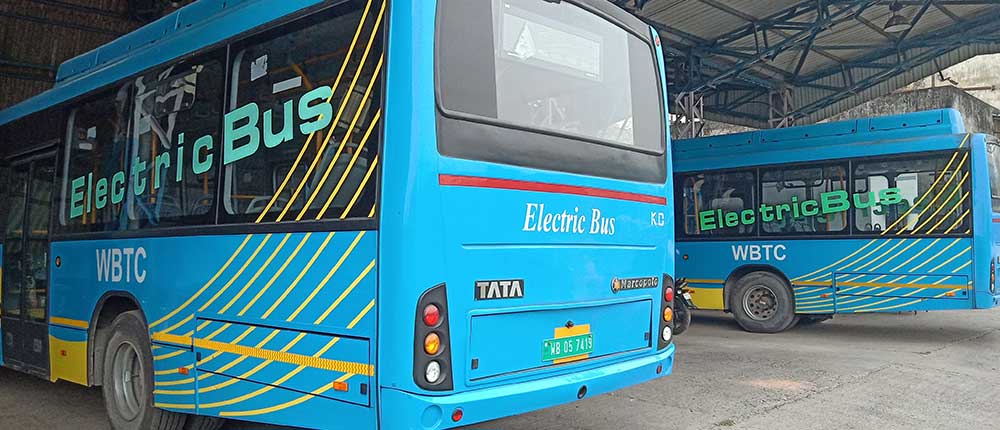
Kolkata has 80-85% shared mobility access (highest in India) wherein public transport options (comprising of buses, metro, and tram network) are being used in large numbers. The city has 1,553 conventional diesel-powered buses of various makes and models operating along 348 routes under West Bengal Transport Corporation (WBTC). These buses have passenger carrying capacity of 35-45 each. A total of 134 routes (nearly 40%) are long distance routes while 60% of the routes have a trip length of less than 20 km.
In order to comply with the emission standards mandated by the Government of India, most of the conventional fleets (more than 1,500 in number) in the city follow Euro-III & IV emission standards, while very few of them (38) comply with the emission criteria set under Euro- II. The average fuel economy of these diesel-based vehicles is around 2-3 km/litre.
Impact of electric buses in Kolkata
The implementation of the electric buses programme in Kolkata has had a great impact on all aspects related to public mobility. The reliability of electric bus operation has seen to be improved up to 98% despite several initial challenges. Moreover, overwhelming responses have been received from the e-bus riders in a survey in terms of comfort and reliability in each trip. Furthermore, the cost of lithium ion batteries has been reducing drastically over the last few years and is expected to drop further in the next two to three years, which will positively impact the viability of e-buses that use these batteries. Although, the impact on air pollution levels has not been as significant as anticipated since very few conventional vehicles have been replaced by e-buses (5% of total conventional fleet) till date, it is expected that annual CO2 emissions will reduce by 3,094 tonnes, considering daily round trip of 100 kms per bus and an emission factor of 1.19 Kg CO2 emissions/km per bus. The impact on the electricity distribution network, which is equally critical to review, has been minimal so far.
As mentioned above, it is also imperative to analyse the impact on utility load curve due to uncontrolled charging of e-buses since these buses are being charged based on driving pattern irrespective of load demand, even though these buses are predominantly charged at night and in the afternoon when the load demand is comparatively less. Though there will be a surge in demand in case large numbers of conventional fleets are converted into electric fleets, utilities may accordingly propose for a variable tariff based smart charging in-order to manage and ensure the smooth operation of their networks.
Conclusion
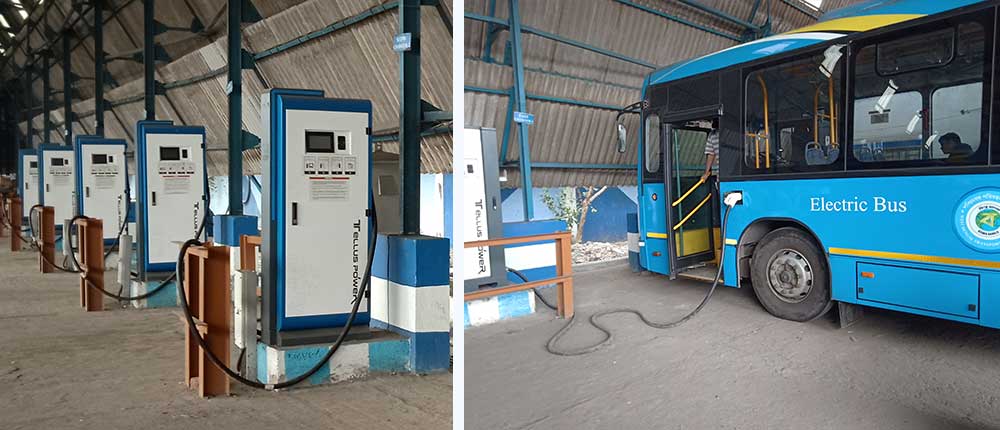
Although 80 e-buses have been accommodated into the existing depots and the Capex was not that large due to the utilisation of the existing assets, setting up new charging infrastructure for additional e-buses remains a major challenge in terms of identifying the appropriate location alongside the number of chargers required in each station based on traffic density and travel pattern.
In addition, frequent tripping of chargers and grid-synchronisations issues were observed to be a major concern during initial phases (up to 4-5 months). However, these issues were rectified through software re-configurations. Therefore, it becomes important to validate the operation of chargers during installation phase itself so that the aforementioned issues do not arise during the running phase. The driving range of the 9m e-buses was also experienced to be lesser than expected (<150 km/ charge) and the range with and without passenger movement was found to be 100 and 130 km per charge respectively. Regular monitoring of bus charging and impact on the local distribution network is being followed. Accordingly, it is essential to monitor and analyse the power quality parameters originating due to e-bus chargers on a regular interval (WBTC has been doing this on a quarterly basis) in order to ensure proper functioning of the electrical network. All these considerations have been acknowledged and the WBTC has been proactively planning to implement ideas on making the ecosystem more sustainable in all aspects. As an example, charging of buses from green energy supplied by solar power plants installed on rooftops of WBTC depots has been encouraged by WBTC and TERI has been entrusted to carry out the study and implementation activities.
As the price for a bus under the Opex model of FAME-II is a little on the higher side, it could be considered as one of the potent challenges to transitioning towards cleaner and low carbon public transport systems. Furthermore, point to point charging facility/ infrastructure is required to better utilise the routes, even though it was not possible for every case due to infrastructural constraints.
Nine terminus points were set up in order to provide intermediate charging facility for the currently operating 80 electric buses. WBTC has also planned to use cleaner sources of energy (solar PV along with battery storage) at its existing e-buses' depots to charge the e-buses. This is expected to result in lower electricity cost for charging e-buses. Besides this, further scope for benefits is foreseen if WBTC plans to opt for a ToD tariff or time-of-use (ToU) tariff scheme coupled with solar plus energy storage (as per TERI's analysis).
For more, see the complete case study conducted by TERI and published in the International Energy Agency's flagship publication Global EV Outlook (GEVO) 2020.