While forests begin to be seen as a tool for carbon sequestration, over 93% of GHG emissions in India continue to emanate from this same resource. This situation will remain unchanged if related policies and programmes are implemented at their current pace and commitment.
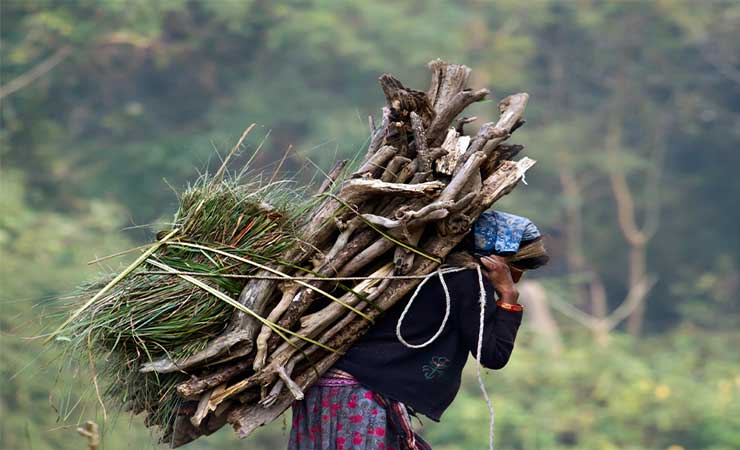
Fuel wood has remained the principal energy source in rural households, as well as in commercial set ups such as brick kilns, hotels and restaurants in semi-urban areas. The primary points of procuring its supply are forests, trees grown on farm lands, homesteads and common land outside forest. The annual fuel wood consumption by 854 million people in India is 216.4 million tonnes per year (FSI, 2011).
The state wise details are given below:
|
Annual Fuel wood Consumption |
||||||
|
1 |
2 |
3 |
4 |
5 |
6 |
7 |
|
S. No |
State/UT |
No. of persons using Fuel Wood (millions) |
No. of Persons using Fuel wood from Forests (Million) |
Quantity of Fuel Wood used (million tonnes) |
Quantity of fuel wood used from Forests (million tonnes) |
Percentage of Column 6 w.r.t column 5) |
|
1 |
Andhra Pradesh |
64.992 |
7.573 |
24.293 |
2.966 |
12.21 |
|
2 |
Arunachal Pradesh |
0.882 |
0.698 |
0.402 |
0.325 |
80.93 |
|
3 |
Assam |
23.373 |
5.812 |
11.421 |
2.494 |
21.83 |
|
4 |
Bihar |
65.816 |
3.115 |
11.475 |
0.465 |
4.05 |
|
5 |
Chhattisgarh |
20.078 |
7.818 |
4.366 |
1.378 |
31.56 |
|
6 |
Gujarat |
40.092 |
7.497 |
9.731 |
2.225 |
22.87 |
|
7 |
Haryana |
8.092 |
0.012 |
1.494 |
0.003 |
0.17 |
|
8 |
Himachal Pradesh |
5.912 |
5.646 |
1.214 |
1.163 |
95.8 |
|
9 |
J & K |
8.375 |
4.54 |
1.394 |
1.015 |
72.8 |
|
10 |
Jharkhand |
21.733 |
9.984 |
4.844 |
2.849 |
58.81 |
|
11 |
Karnataka |
44.681 |
9.584 |
20.967 |
5.776 |
27.55 |
|
12 |
Kerala |
29.504 |
4.429 |
14.543 |
2.183 |
15.01 |
|
13 |
Madhya Pradesh |
51.007 |
24.839 |
13.665 |
7.191 |
52.63 |
|
14 |
Maharashtra |
68.904 |
31.845 |
9.508 |
4.527 |
47.61 |
|
15 |
Orissa |
33.029 |
11.11 |
8.894 |
2.971 |
33.4 |
|
16 |
Punjab |
13.628 |
0.136 |
3.348 |
0.029 |
0.87 |
|
17 |
Rajasthan |
57.992 |
11.414 |
18.782 |
3.698 |
19.69 |
|
18 |
Tamil Nadu |
42.405 |
7.429 |
12.387 |
2.601 |
21 |
|
19 |
Uttar Pradesh |
175.096 |
10.495 |
19.063 |
1.294 |
6.79 |
|
20 |
Uttarakhand |
7.289 |
6.06 |
2.566 |
2.139 |
83.38 |
|
21 |
West Bengal |
51.202 |
18.574 |
14.158 |
6.361 |
44.92 |
|
22 |
North Eastern States |
9.383 |
6.588 |
5.274 |
3.822 |
72.48 |
|
23 |
UTs |
10.412 |
4.432 |
2.633 |
1.272 |
48.32 |
|
|
Grand Total |
853.877 |
199.63 |
216.422 |
58.747 |
27.14 |
Source ISFR, 2011
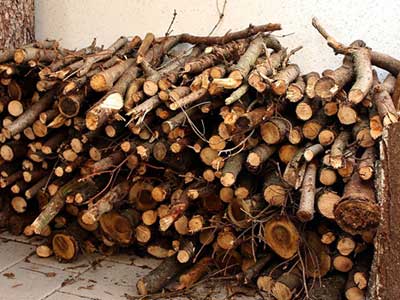 India is home to more than 240 million households out of which about 100 million households are still deprived of LPG as cooking fuel and have to rely on firewood, coal, dung - cakes etc., as primary sources of cooking. The smoke from burning such fuels causes alarming levels of household pollution and adversely affects the health of women and children, causing several respiratory diseases and disorders. The Government of India has also withdrawn the subsidy given on LPG which has resulted in increased use of fuel wood for commercial purpose in semi-urban areas. The source of energy for domestic and commercial use in rural and semi urban areas is largely fuel wood, which contributes to more than 93% of Greenhouse Gas (GHG) emissions from forestry sector in India (Sharma, 2017).
The estimated scenario of GHG emissions and removal of CO2 is given below:
Table 2: Inventory of GHGs in Forestry Sector in India (BAU)
|
Estimated Emissions/Removals |
2015 |
2020 |
2025 |
2030 |
|
Total emissions |
482.84 |
539.16 |
587.71 |
626.95 |
|
Total removals |
398.87 |
408.11 |
415.03 |
422.36 |
|
Net Emissions |
83.97 |
131.05 |
172.68 |
204.59 |
Source: TERI Analysis
The above scenario has led to forest degradation in significant terms which is quantified below:
Table 3: Trends of forest resources as reported in India's State of Forest Reports (IFSR)
|
Forest resource accounting variable |
ISFR 2003 |
ISFR 2005 |
ISFR 2009 |
ISFR 2011 |
ISFR 2013 |
ISFR 2015 |
Net Change between 2003 to 2015 |
% change between 2003 to 2015 |
|
Forest Cover (in square kilometres) |
686,767[1] |
692,027[2] |
690,899 |
692,027 |
697,898 |
701,673 |
14,906 |
2.17 |
|
Growing Stock in Forests (million cubic meters) |
4781.414 |
4602.04 |
4498.7 |
4498.73 |
4173.36 |
4195.047 |
-586.367 |
-12.26 |
|
Growing Stock in Forests and Tree outside forests (million cubic meters) |
6413.752 |
6218.28 |
6098.2 |
6047.15 |
5658.05 |
5768.387 |
-645.365 |
-10.06 |
Source: FSI 2003; FSI, 2005; FSI 2009; FSI 2011; FSI 2013; FSI 2015
[1] Forest cover corrected for change of scale reported in IFSR 2009
[2] Forest cover corrected for change of scale reported in IFSR 2009
The chart shows that there is reduction in the growing stock from 2003-2015 and will be further reduced if policy and programmes are implemented as business as usual. The forestry sector will continue to be the net source of GHG emissions in the future due to unsustainable harvest of fuel wood and other Minor Forest Products, forest fire, overgrazing and poor regeneration. The overdependence on forests for livelihood and domestic consumption must be substituted with natural resource based livelihood and irrigated agriculture, and assisted natural regeneration which requires 6,153 million US $ per year. This is in addition to other interventions such as community based forest governance, capacity building of frontline staff and community, and engagement with private sector. This will help India in not only achieving its Nationally Determined Contributions related to the forestry sector - mitigating climate change, poverty alleviation, biodiversity conservation and improvement in the quality of forests - and national biodiversity targets, but also contributing towards fulfilling the global targets of SDG 13,14,15, and Aichi Targets.
References
- FSI. (2003). India State of Forest Report 2003 Forest Survey of India (FSI), Ministry of Environment, and Forests (MoEF&CC).
- FSI. (2005). India State of Forest Report 2005 Forest Survey of India (FSI), Ministry of Environment, and Forests (MoEF&CC).
- FSI. (2009). India State of Forest Report 2009 Forest Survey of India (FSI), Ministry of Environment, and Forests (MoEF&CC).
- FSI. (2011). India State of Forest Report 2011 Forest Survey of India (FSI), Ministry of Environment, and Forests (MoEF&CC).
- FSI. (2013). India State of Forest Report 2013 Forest Survey of India (FSI), Ministry of Environment, and Forests (MoEF&CC).
- FSI. (2015). India State of Forest Report 2015 Forest Survey of India (FSI), Ministry of Environment, and Forests (MoEF&CC).
- Sharma J. V. (2017). Roadmap for achieving additional 2.5-3 billion Tons eCO2 Sequestration from Forestry Sector by 2030, Policy Brief, TERI, New Delhi.