Due to the increase in anthropogenic activities, global temperatures have shown a warming trend of approximately 1°C (likely between 0.8°C and 1.2°C) above pre-industrial levels. Annual surface air temperatures over India also have shown increasing trends of similar magnitude during the period 1901–2014. The Sixth Assessment Report (AR6) of The Intergovernmental Panel on Climate Change (IPCC) released in 2021 has predicted heat waves and heat stress to be more intense and frequent during the 21st century in South Asian region including India. In India, heat wave conditions are usually experienced between March and July, with acute heat waves occurring mostly between April and June.
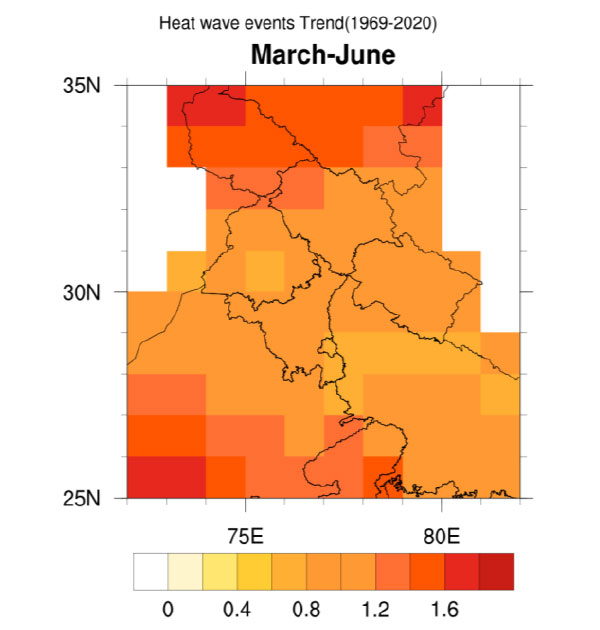
Long term trend in seasonal heat wave events shows a significant increasing trend in the north-western and northern parts of India. The subdivisions of Uttar Pradesh observed an increase of 0.8 events/year and North Rajasthan with 0.8 events/year and South Rajasthan of 1.4 events/year. Similarly, an increasing trend in Punjab, Haryana, and Uttarakhand region and some regions of Eastern Uttar Pradesh has been noticed (Figure 1). The capital of India, Delhi also shows an increase of 0.80 heat wave events/year.
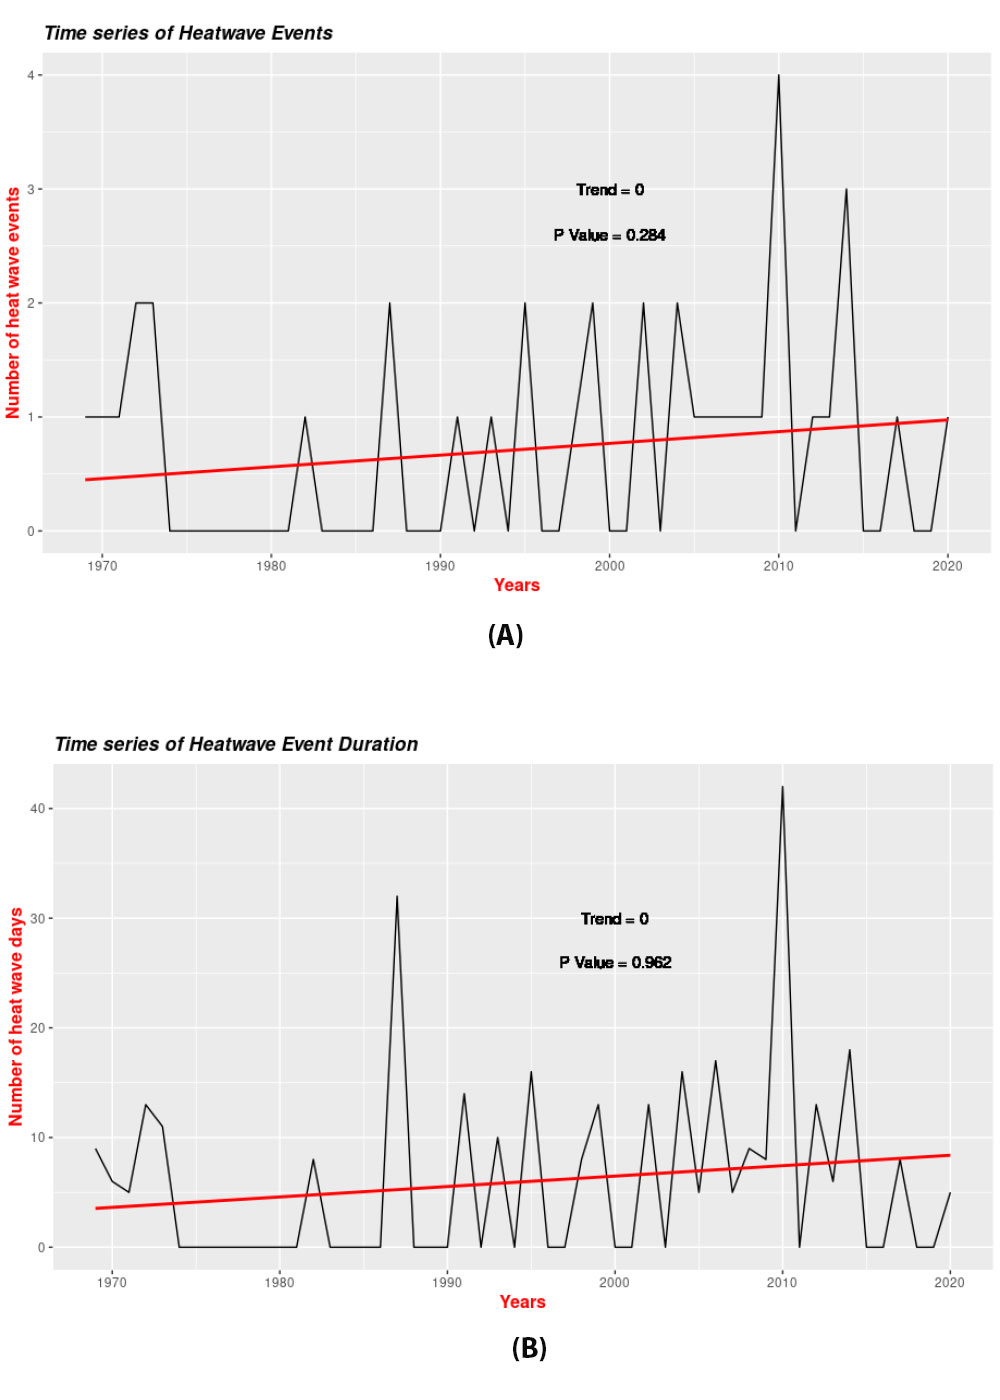
Time series of frequency of heat waves and their duration over Delhi (IMD's Safdarjung station) are shown in Fig 2(A) & (B). The frequency of heatwaves over Delhi has shown an increase of 0.30 per decade in the recent 30 years period (1991-2020). The number of heat wave spells over Delhi appearing to be more frequent as compared to past years. The recent 30 years' time series are showing statistically significant (at the 90% confidence level) increasing trends. The long term data (1969-2020) shows heat wave events a slight increasing trend, however, the trends are not statistically significant. Similar patterns can be seen in heatwave days (refer Fig 3). Figure 2(B) shows the duration also has a slight upward trend. Further, the heat wave analysis carried for the COVID-19 pandemic year 2020 shows one heat wave (24-28 May) formed over Delhi during the summer season.
2020 (March- July)
While mortality rates due to heat waves or heat stress usually are a metric for the severity of the situation, but there are less obvious but equally important metrics such as long term health effects, lower productivity and increased (financial) costs associated with coping with heat. A major category of population affected by heat stress was identified as low income groups (Harlan et al., 2006). This is largely the case in developing countries where the number of people from low income categories is much higher. With reference to coping during heat waves, having access to cooling devices and the financial means to use them is an important aspect for enhancing the adaptive capacity of the population.
During the COVID-19 pandemic people across the country were confined to their homes with schools and office buildings closed. This has shifted the need to cope with heat during the day from the workplace to the home. Their usage of electrical cooling appliances such as air conditioning and coolers (a more basic device, with a fan blowing air over a layer of water to cool it) must is likely to have been more increased compared to previous years as jobs, schools, etc., operated on a work/study from home basis.
India experiences the eighth warmest year in 2020 since 1901, however, during the summer season the temperature was below normal (-0.03℃) and was relatively mild - examined and compiled in a report titled 'Climate of India during 2020' by the Climate Research and Services (CRS) of the India Meteorological Department (IMD). i Similarly, in Delhi an unprecedented combined impact of Covid-19 lockdown and extreme heat waves has fortunately been avoided in the peak of summer of 2020 (on May 19-20) interrupted by the gusty winds and intense showers bringing the temperatures down in the capital. Still, especially people in densely built, low-income neighbourhoods, with no open green spaces, remain unsheltered from heat even at night. Increased use of electricity comes at a cost, at a time many families are cash strapped due to loss of income.
To understand the severity of the heat waves and the impact it had on the different socio-economic groups in society we conducted a small survey among the employees of The Energy Resources Institute (TERI), in Delhi, India having different socio-economic background. We asked people if the lockdown of summer months of 2020 (March to June) impacted household energy consumption and expenses compared to the last summer. We also enquired on access to different cooling devices, income range, and number of work from home days during the lockdown and housing conditions.
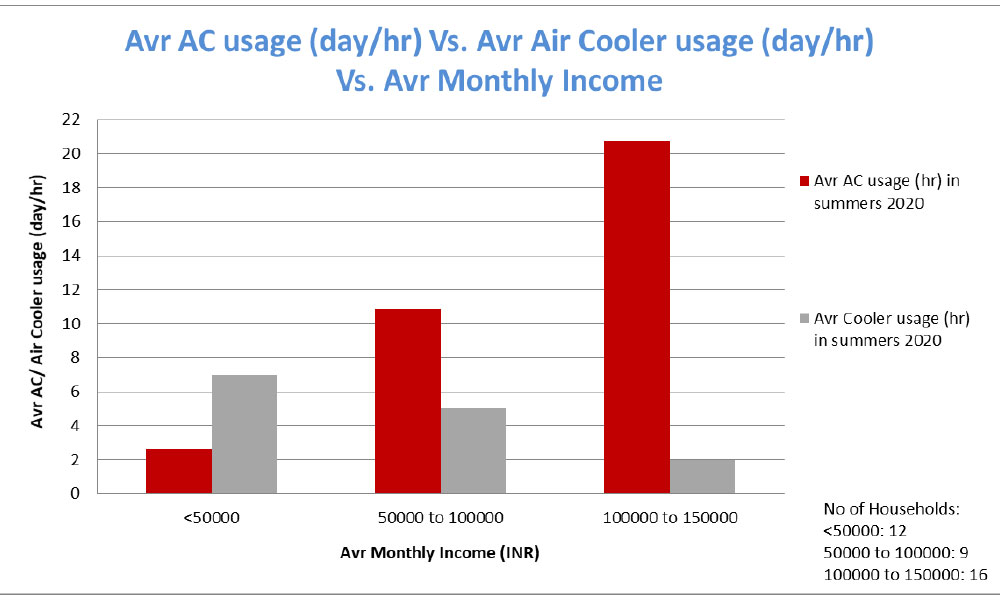
As economic conditions of households vary, the ability to afford or run an air conditioning (AC) device, we asked respondents with different income levels about the usage of coolers versus that of ACs with respect to income brackets. The data analysed (Figure 3) for the survey shows that once people cross the lowest income threshold, they tend to shift to the use of AC or shift to more expensive devices for cooling. The use of more simple air coolers, relatively cheaper as compared to ACs decreases with income levels (Figure 3). Families of higher income brackets tend to have higher usage patterns of cooling devices as opposed to people from lower income brackets.
As average income levels rise, the average electricity consumption of the household also increases (Figure 4), establishing a direct relationship between income levels and electricity consumption. It is also seen from the figure that the number of cooling devices in a household also increases with rise in average income levels.
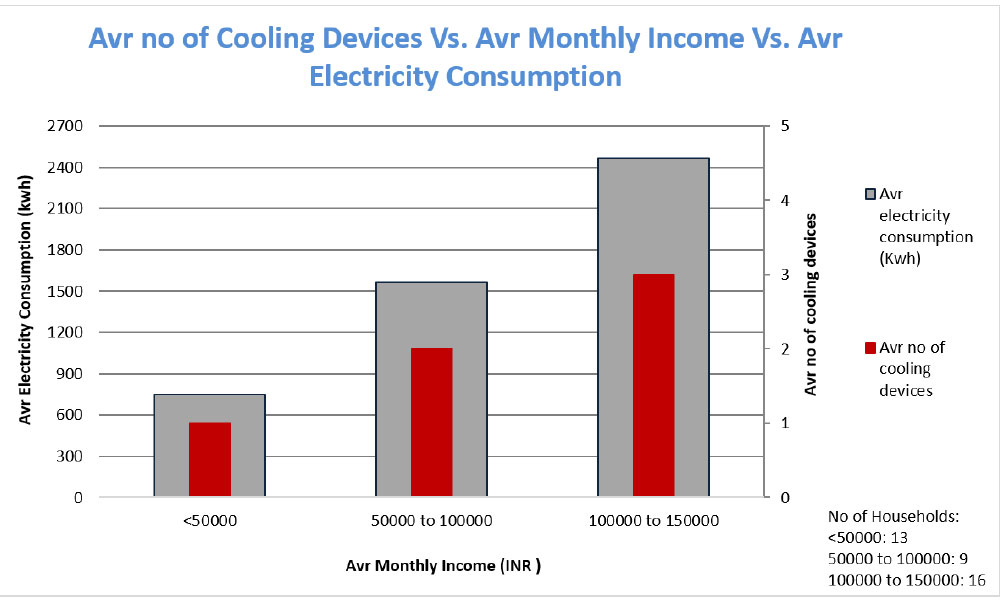
The increase in the number of cooling devices of a household also implies an increase in the consumption of electricity.
A comparative analysis of the summer of 2020 versus that of 2019 shows around 80% of respondents reporting a higher consumption of electricity in 2020. This could be largely related people spending more time at home due to the 'work from home' policy. The respondents also stated to have increased electricity expenditure of the total household expenditure as compared to the previous year which indicates household adaption to increasing summer temperatures.
This analysis has been carried out with a small group of colleagues of TERI and gives suggestive patterns of electricity consumption during the first lockdown. Similar analysis conducted by other agencies indicates how overall energy demand was reduced during the complete lockdown phase during the COVID because of the reduction in demand in commercial and industrial activities. However, the residential electricity consumption, was expected to have increased during the lockdown as people spent more time at home. To sum up, the overall impact on demands is not clear given the official sector-wise data on electricity consumption is still not publicly available. There are varied outputs from different pieces of research that have focussed on the topic. A study conducted by the CSE says household consumption was not affected during the lockdown in Delhiii; another study by Prayas (Energy Group) in Uttar Pradesh and Maharashtra found daily average electricity consumption higher in the lockdown period as compared to the pre-lockdown period in the sampled householdsiii. However one needs to check what parameters of assessment were considered in these studies and what was the overall focus and goal with which the information was collected.
Access to cooling can be an effective means of managing heat stress – but unfortunately, people with low income classes have dramatically lower access to cooling (as also can be seen from this present study). However, these low income classes are the ones who are more affected during peak summer temperatures and heat wave conditions because of the thermal discomfort in the poorly designed buildings with limited ventilation they reside.
Also, besides the poor, the upper and lower middle class are also stretched to their financial limits given the need for better healthcare services and adapting to heat stress conditions during peak summer times. A growing concern is that India houses a large proportion of its population in the middle income category and the consequences of the biophysical impact on the economics of households presents further challenges for the country as a whole.
A detailed study on understanding the implications of such extremes on the social strata across different settings is needed. The situation may vary from one city to the other given the changes in the tier of the city, overall governance and policy norms and the role of the distributors/ discoms. There is a need to understand the differential vulnerabilities that get created due to the varying underlying conditions for effective adaptation to be promoted.
References
- Harlan, S. L., Brazel, A. J., Prashad, L., Stefanov, W. L., & Larsen, L. (2006). Neighbourhood microclimates and vulnerability to heat stress. Social Science and Medicine.
- IPCC, 2021: Summary for Policymakers. In: Climate Change 2021: The Physical Science Basis. Contribution of Working Group I to the Sixth Assessment Report of the Intergovernmental Panel on Climate Change [MassonDelmotte, V., P. Zhai, A. Pirani, S. L. Connors, C. Péan, S. Berger, N. Caud, Y. Chen, L. Goldfarb, M. I. Gomis, M. Huang, K. Leitzell, E. Lonnoy, J. B. R. Matthews, T. K. Maycock, T. Waterfield, O. Yelekçi, R. Yu and B. Zhou (eds.)]. Cambridge University Press. In Press.
Footnotes:
[i] https://pib.gov.in/PressReleaseIframePage.aspx?PRID=1686173
[ii] https://www.cseindia.org/cse-releases-new-analysis-of-electricity-consumption-in-delhi-duringthe-lockdown-10314
[iii] https://www.prayaspune.org/peg/blogs/household-electricity-consumption-in-india-during-the-covid-19-lockdown-insights-from-metering-data.html