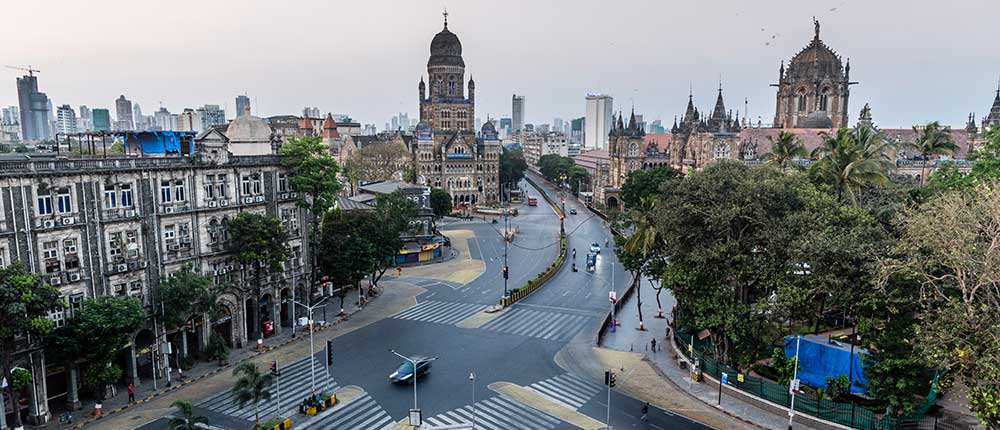
During COVID-19 pandemic and subsequent lockdown, the clear skies and clean air have turned out to be the blessings in disguise for the millions affected due to air pollution in India.

The novel Coronavirus (COVID-19) pandemic led to a nationwide lockdown affecting the life of 1.3 billion population across the country. In an attempt to slow the spread of this infection, a 'total lockdown' has been imposed with restrictions on day-to-day movement and ban on all commercial and industrial activities. The clear skies and clean air have turned out to be the blessings in disguise for the millions choking on polluted air across Indian cities. The top Indian cities with the track record of world's worst air quality, this1 is an unforeseen benefit amidst Coronavirus pandemic.
Globally, air pollution is the leading risk factor for public health and early death, contributing to adverse health conditions such as heart diseases, stroke, respiratory infections and lung cancer2.
The unexpected clean air experiment
The sudden changes in the environment due to the current lockdown presents us with a unique learning situation in terms of considerable reduction in the air pollution levels. Within two weeks into the initial 21-day lockdown Delhi's air quality status had already achieved the "satisfactory" (AQI 50-100) or "good" (AQI 0-50) category.
Particulate Matter (PM2.5) or fine particulates with its diameter smaller than 2.5 μm has a direct impact on the human health. It is, therefore, one of the criteria pollutants used to calculate Air Quality Index (AQI). PM2.5 is considered particularly dangerous as it can be inhaled deep into the lungs causing respiratory illnesses3.
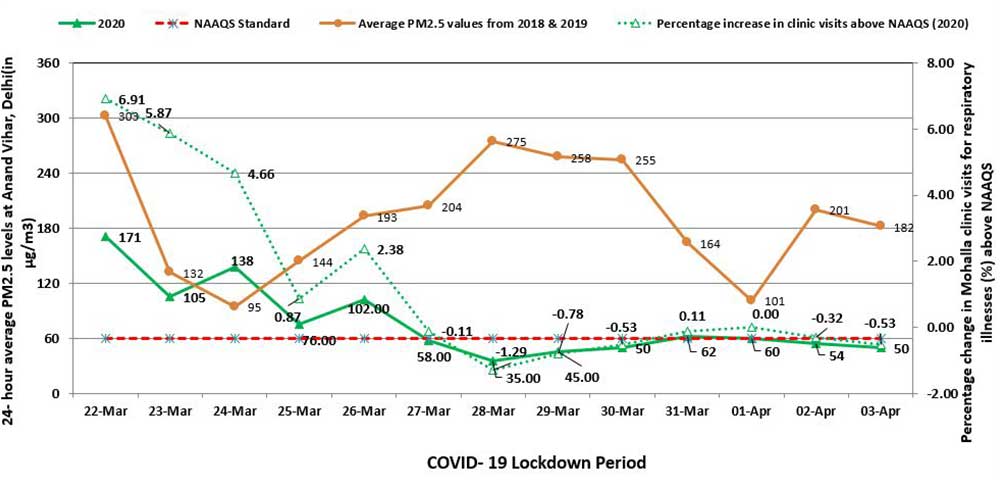
By the first week of the lockdown, the daily 24-hour average concentrations of particulate matter (PM2.5) dropped by almost 70% in the Anand Vihar region of Delhi. Otherwise, this area has been notorious with the worst air quality status and as one of the major air pollution hotspots of Delhi. This is a dramatic change as compared to daily 24- hour average PM2.5 data4 of March in the last three consecutive years from 2018-20 (graph attached). It is a clear visualization of how PM2.5 level has dropped remarkably (76 μg/m3) on 25 March as compared to the same day in the previous years. Due to the lockdown, the PM2.5 level at Anand Vihar has seen a huge dip and we have already achieved the National Ambient Air Quality Standard (NAAQS) limit of 60 μg/m3.
Tool-predicting clinic visits from air pollution
A statistical (GAM-Generalized Additive Model) predictive model based digital tool5 has been developed by TERI's Environment and Health team for the Delhi-NCR region. One of the key team members include Professor Sujit Kumar Ghosh6, Department of Statistics, North Carolina University and also serve as Distinguished Visiting Fellow at TERI.
This tool explores several PM2.5 level-based scenarios to assess health benefits. As it estimates the increase in the Mohalla clinic visits for short- term respiratory illnesses in the local community. As per this model, when PM2.5 level rise from 60 to 225 μg/m3, then nearly 11% increase in clinic visits is expected for respiratory health effects under normal conditions.
Tool Information:
|
The graph (attached below) shows that the drop in PM2.5 levels would lead to a dramatic reduction in the percentage of mohalla clinic visits. Almost a 7% reduction is expected, from March 22nd when PM2.5 is close to 170 μg/m3 to April 1st when the PM2.5 has already hit the national air quality standard of 60 μg/m3. Ultimately, this reaps direct economic benefits of cleaner air through reduction in doctor visits and lower medical costs. Also, indirect benefits in the form of lesser work- loss and school- loss days.

Sector-wise attribution
This model can also be used to determine the expected reduction in respiratory clinic visits by eliminating different sources of PM2.5 in Delhi-NCR region. Following a statistical approach, we computed the clinic visit attributable to different sectors from crop residue burning, transport, residential, road dust, industry and others (refuse burning, diesel generator sets etc.)
For this purpose, we used the sector- specific contribution of PM2.5 from a recent TERI study7 to determine the proportion of respiratory illness that could be attributed to emissions from that specific sector. This estimation was done using an epidemiological formula based on the model data and by incorporating PM2.5concentrations and source apportionments of PM2.5. Keeping in mind, the difference of source contributions across seasons this exercise was done for both summers and winters.
Using this approach, nearly 1% of the respiratory illness visits to the clinics in Delhi could be attributed to air pollution from agriculture residue burning (37%). This attribution also suggests that larger health benefits would accrue from reduction in emissions from industries, and transport sector (ranging from close to 3 to 8 % in winter and 2 to 5 % in summer season). Thus, emerges the need to track air pollution levels and related health effects to prompt sector- specific tactical strategies.
The Takeaway
The clear lessons from this unique lockdown situation is that the once impossible scenario of breathable air and clean skies is achievable even in a limited span. However, under the normal circumstances it is only possible by stricter implementation of concrete strategies to reduce air pollution.
Also, the recent research suggests association between air pollution and COVID-19 death cases8. Based on this, the highest death tolls are from regions with the highest pollution levels. As the people in such regions are at higher risk with pre-conditions such as chronic respiratory conditions which limits the body's immunity to fight infections such as coronavirus . Though the findings are pre-liminary, but it still teaches us a lesson to build robust sector- specific strategies for clean air in order to avoid such situations.
Along with government policies, we need to mobilize behaviour change to keep up the unexpected positive benefits out of this lockdown situation. May be after this lockdown, due to the fear of infection we will see further rise in private vehicles. So, there's a need for newer norms of "work-from-home" to creating "sustainable environments" as a key for the upcoming situation. With this realization, we need to make day-to-day green choices to move towards a better tomorrow with cleaner air: car-pooling with family and friends, limiting activities to run errands around the neighborhood, particular days on the week/month for market visits/groceries etc., walking/ cycling over drive or investment and adoption of green energy choices in terms of infrastructure, energy efficiency, e-vehicles etc.
The choice is ours; the route is behaviour change and the key lies in the new norms!
Footnotes
[1] https://www.iqair.com/world-most-polluted-cities
[2] https://www.who.int/airpollution/ambient/health-impacts/en/
[3] https://www.who.int/quantifying_ehimpacts/publications/ebd5.pdf
[4] https://app.cpcbccr.com/AQI_India/
[5] https://statconsulta3.shinyapps.io/app_instruction5/
[6] https://www4.stat.ncsu.edu/~ghosh/
[7] https://www.teriin.org/sites/default/files/2018-08/Report_SA_AQM-Delhi-NCR_0.pdf
[8] https://projects.iq.harvard.edu/covid-pm
[9] https://www.who.int/docs/default-source/coronaviruse/situation-reports/20200311-sitrep-51-covid-19.pdf?sfvrsn=1ba62e57_10
