Thoothukudi has been designated as a non-attainment city under India’s National Clean Air Programme (NCAP).
Thoothukudi, also known as Tuticorin, is a rapidly growing Tier-II industrial port city in Tamil Nadu. The V.O. Chidambaranar (VOC) Port, located in the city, is one of the country’s significant all-weather ports and serves as a major gateway for maritime trade in South India. Activities related to industry and the port operations drive both freight and passenger movement, extending beyond the city boundaries and contributing significantly to the city’s greenhouse gas (GHG) emissions. Additionally, Thoothukudi has been designated as a non-attainment city under India’s National Clean Air Programme (NCAP). Recognizing this challenge, the city has undertaken an evidence-based baseline analysis of GHG emissions for the road transport sector.
This analysis combines data from field surveys, secondary datasets and dual modelling approaches developed by Cenex and TERI to establish a Road Transport Baseline GHG emissions inventory for the city to inform policy and planning. Together, these models provide a robust baseline to guide mitigation actions, freight management reforms, and clean mobility planning. The assessment also supports the development of a Climate Integrated Strategy for Urban Planning and Mobility, which will outline a pathway for the city aligned with Tamil Nadu’s broader net-zero vision.
The field survey conducted by TERI included respondents from 2406 vehicles (1407 passenger and 999 freight vehicles) across seven locations representing diverse geographies, including both core urban and peri-urban areas. The survey collected detailed information on travel behaviour, fuel consumption, vehicle ownership, and freight movement to establish a robust baseline of transport-related GHG emissions. The secondary data sources included vehicle registration data from the Vahan database managed by the Ministry of Road Transport and Highways (MoRTH) and operational data of buses from the Tamil Nadu State Transport Corporation (TNSTC). Moreover, cargo data from VOC Port was used to support the background of the study.
To strengthen the robustness of the analysis, independent bottom-up modelling approaches applied by TERI and Cenex were undertaken using consistent underlying datasets that produced highly similar results, including closely aligned distributions of emissions between passenger and freight vehicle categories. Both assessments indicate that freight transport accounts for approximately 60–65% of total road transport emissions, while passenger vehicles contribute about 35–40%. This strong convergence provides greater confidence in the robustness of the emissions estimates and underscores the significant role of freight activity in the city’s transport-related carbon footprint.
Key Insights from the Analysis
GHG emissions are estimated for the vehicle stock, defined as the number of in-use vehicles in Thoothukudi in the base year 2024-25[1]. The vehicle stock assessment of Thoothukudi’s on-road fleet illustrates high dominance of two-wheelers followed by cars, freight vehicles, buses, and other modes of transport. Freight vehicles collectively account for approximately 8%, reflecting the city’s industrial and port-linked freight movement (Figure 1).
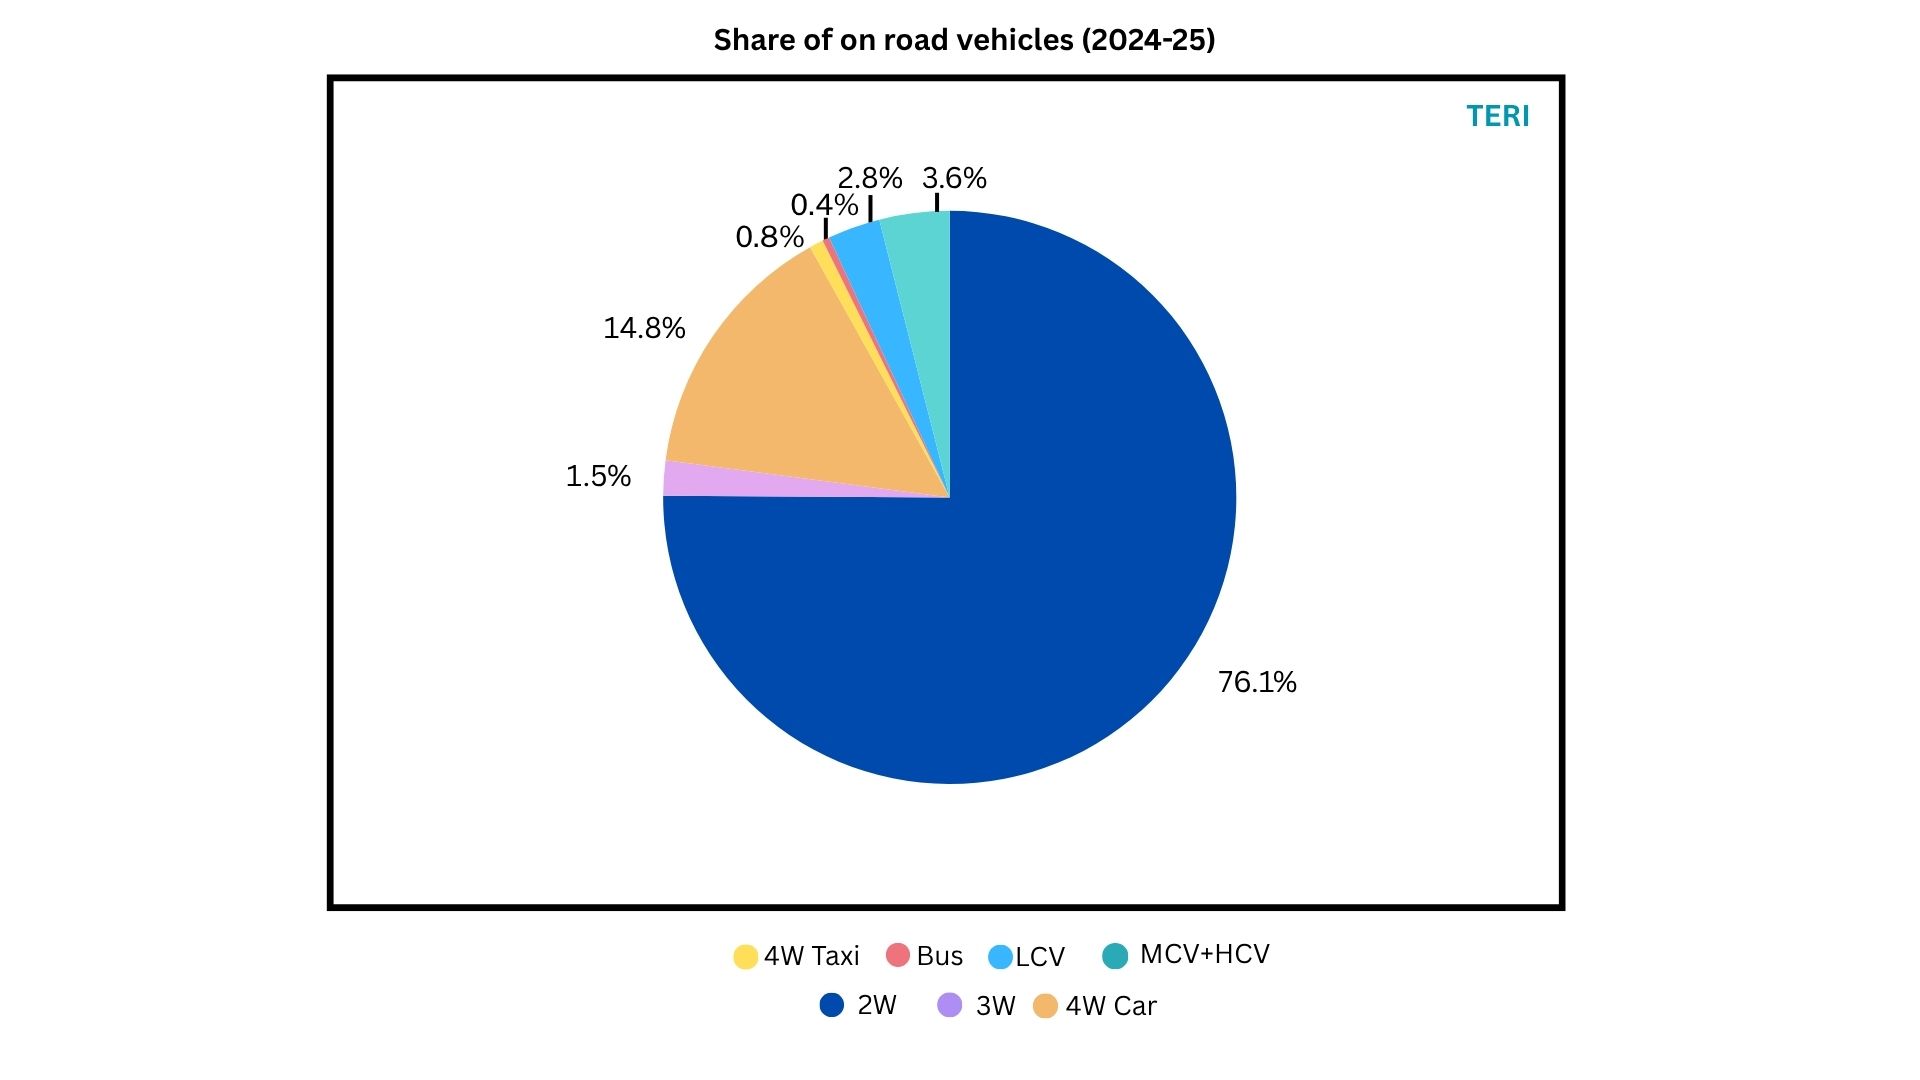
Figure 1: Share of on road vehicles (2024-25)
Source: TERI analysis
Note: 2-W represents 2-wheeler passenger vehicles. 3-W are 3-wheeler vehicles (both passenger and goods), LCV is light commercial vehicle, MHCV is Medium and heavy commercial vehicle.
Survey findings indicate that work-related trips account for most of the daily travel, particularly for two-wheelers and shared modes, while private cars show a more mixed pattern of work, personal, and leisure travel.
Despite employing different methodologies, both approaches consistently identify freight operations as the primary source of emissions, thereby identifying them as a key priority for decarbonization initiatives. The assessment conducted by TERI and Cenex confirms that freight accounts for approximately 60% to 65% of the overall emissions from the transport sector, as compared to the passenger vehicles, which accounts to about 35% to 40% (Figure 2).
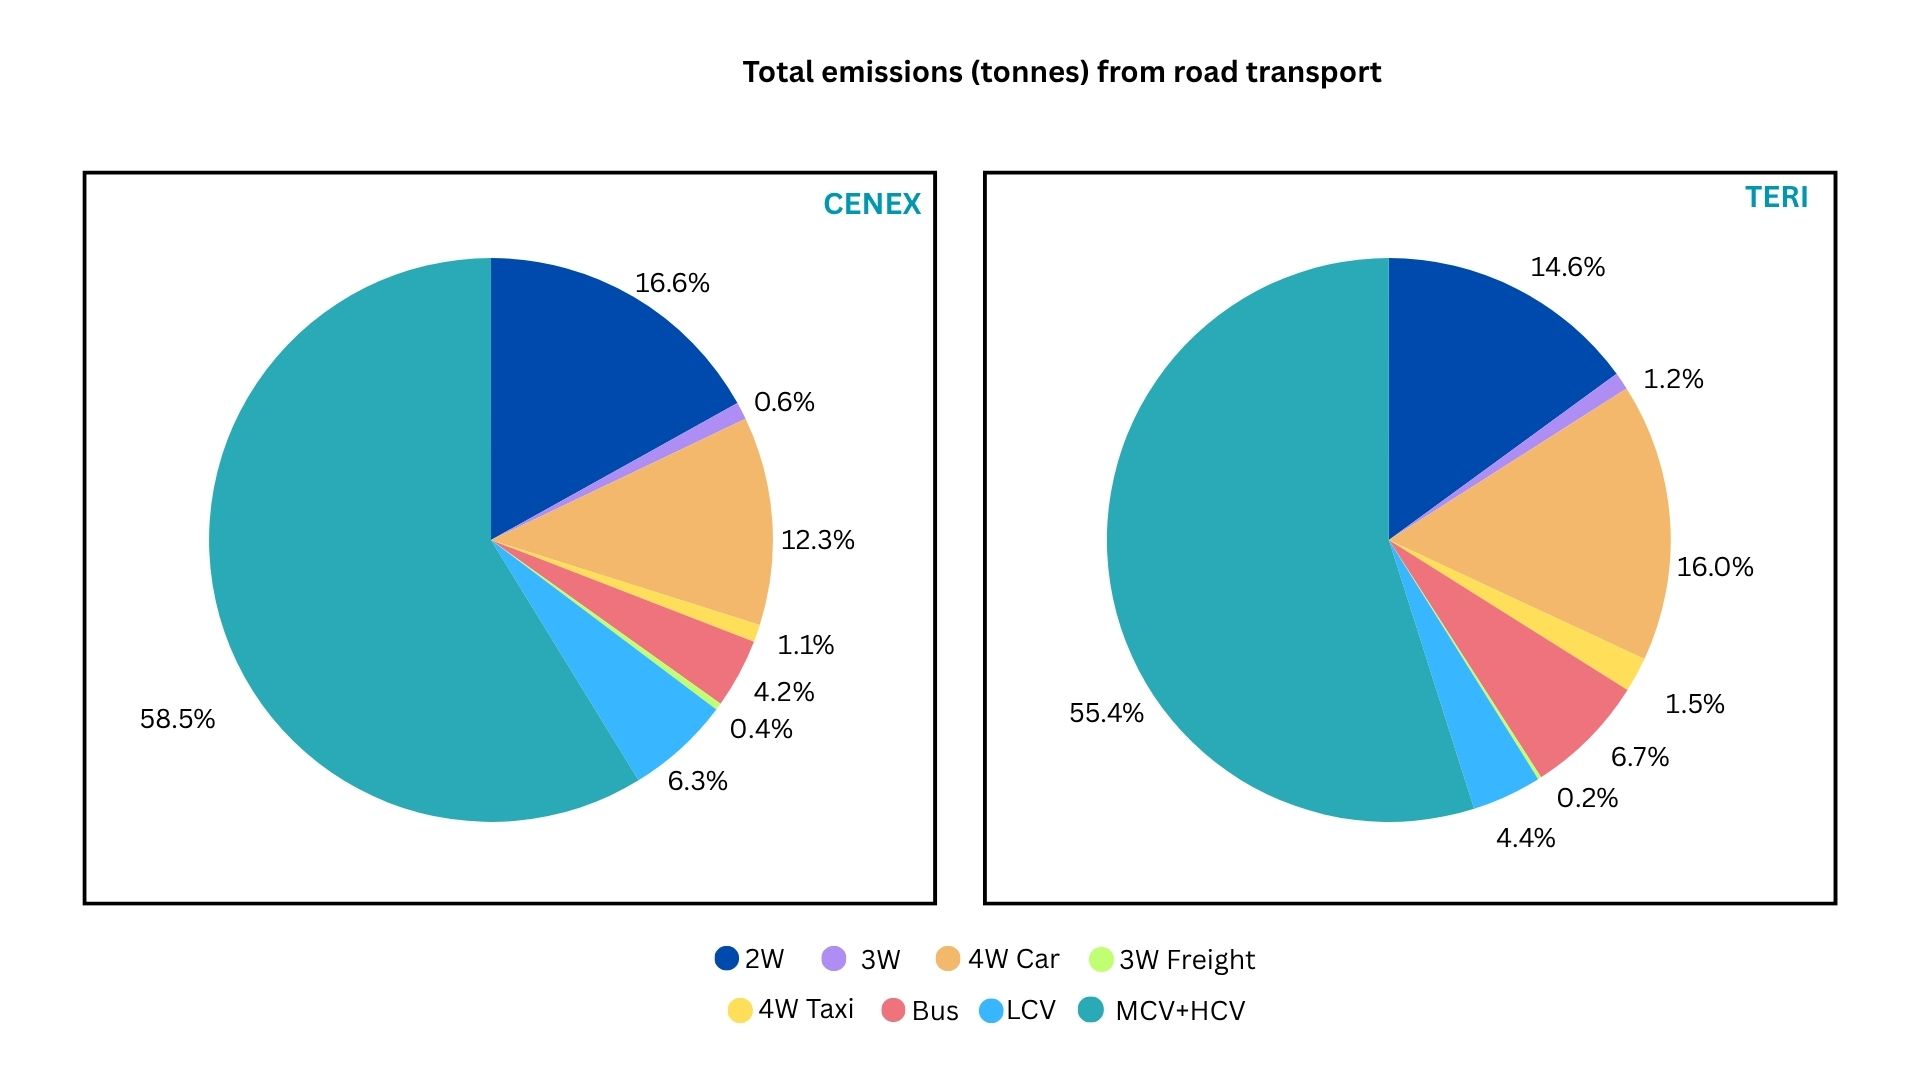
Figure 2: Total emissions split comparison.
Source: Cenex & TERI analysis
This high freight-to-passenger ratio illustrates the fundamental structural characteristics of Thoothukudi as a port city, in which long-haul and mid-haul commercial vehicles overwhelmingly dominate road utilization. The breakup of emissions from freight vehicles is illustrated in Figure 3.
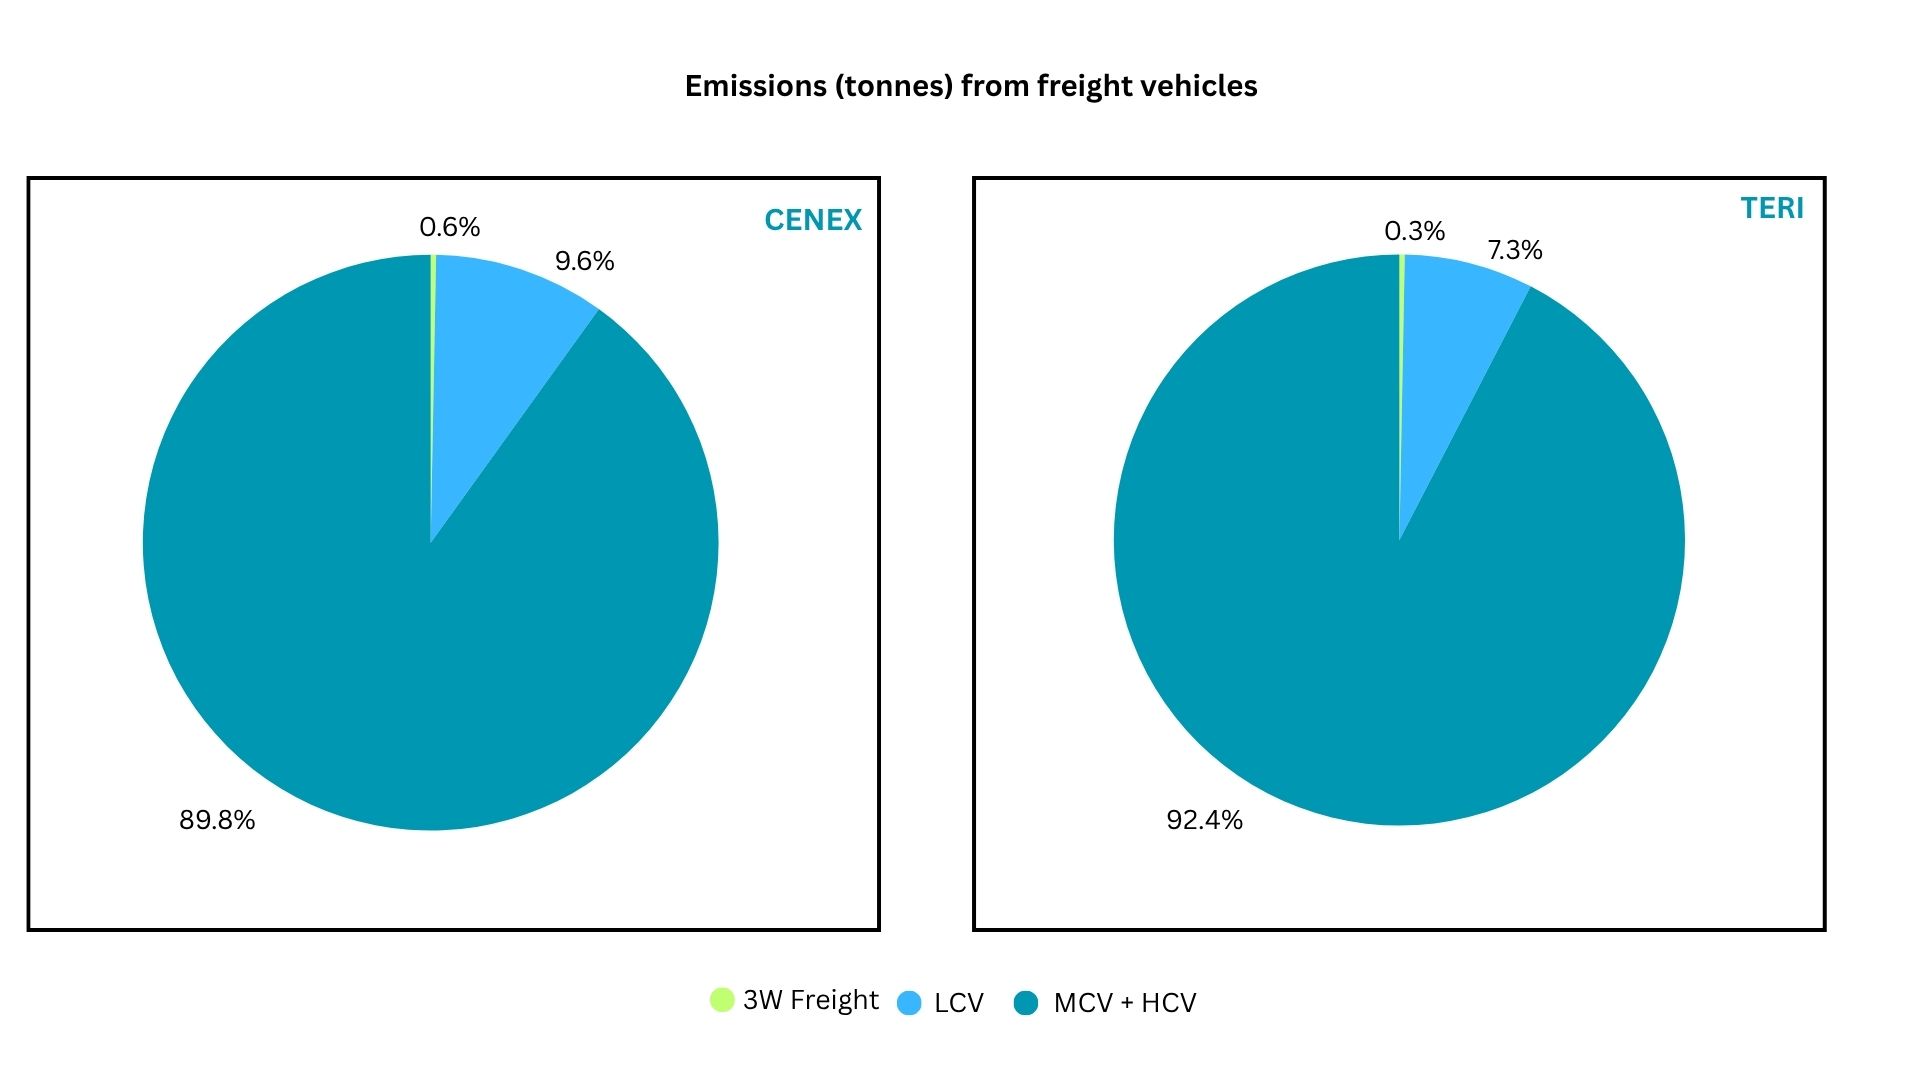
Figure 3: Comparison of emissions from freight vehicles.
Source: Cenex & TERI analysis
The dominance of emissions from the freight segment is driven by several structural factors. Port-centric movement, which was overwhelmingly shaped by the VOC Port, where 100% of export cargo and more than 61% of import cargo moves by road[2], generating heavy commercial traffic on key corridors. The survey confirms the large operational presence of multi-axle trucks, container carriers and tankers, many of which operate through long and unbalanced haul cycles.
A large proportion of the freight vehicles consists of ageing fleet (predominantly 10 to 24 years old diesel trucks), including a high number of multi-axle trucks and container carriers that remain in operation well beyond 10 years of service, often complying to pre-BS IV/ BS VI emission standards.
Road-based freight dominates both exports and a large share of imports at the VOC Port, with rail and other modes playing a limited role. This heavy reliance on road transport amplifies the climate impact of port operations and places freight decarbonization at the centre of the city’s transport-climate agenda.
Passenger vehicles also contribute a substantial share of total road-transport emissions, but their per-trip and per-kilometre emissions are generally lower than those of heavy freight vehicles. Two wheelers have the highest share (~37% to 48%) in the emissions, followed by cars (~35% to 41%) and buses (12% to 16%) (Figure 4).
Buses, although fewer in number, carry nearly 29% of passenger-kilometre, demonstrating the efficiency and advantages of mass transport. When measured in emissions per passenger-kilometre, buses perform significantly better than private modes, reinforcing the importance of protecting and strengthening public transport systems as part of any decarbonization strategy.
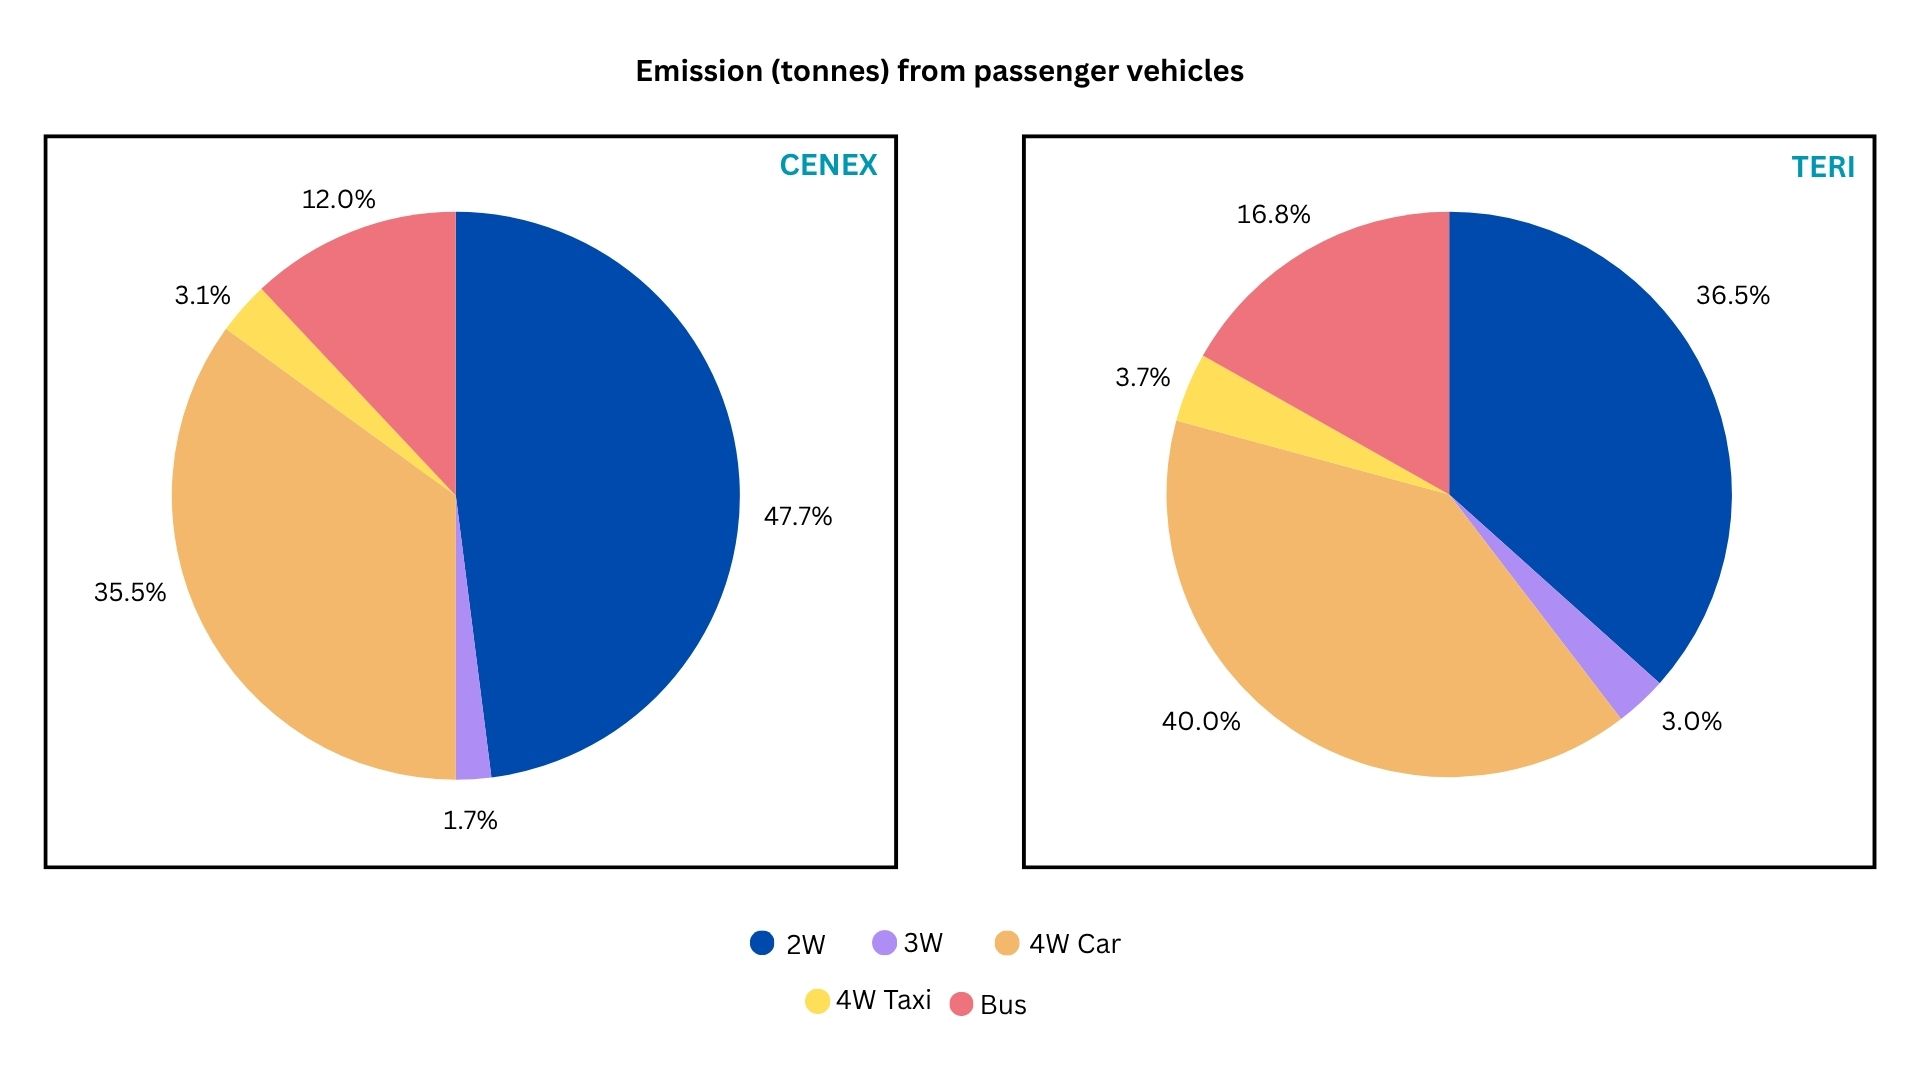
Figure 4: Comparison of emissions from passenger vehicle.
Source: Cenex & TERI analysis
Scope Matters: Understanding Direct and Indirect Emissions
An important technical insight from the inventory is the role of emission scopes in shaping how cities interpret transport emissions. The Global Protocol for Community-Scale Greenhouse Gas Emission Inventories (GPC) is a standard global framework for measuring and reporting city-level GHG emissions, which categorizes transport-specific emission sources into three scopes. Scope 1 emissions are the direct GHG emissions from burning fuel for transport within the city boundary. Scope 2 emissions are the indirect GHG emissions from grid electricity used for electric vehicles within the city boundary. Scope 3 emissions are the indirect GHG emissions from parts of transboundary trips occurring outside the city boundary.
A large share of Thoothukudi’s freight emissions (82%) falls under Scope 3, as they are associated with trips that extend beyond municipal boundaries but are generated by city-based economic activity, particularly port operations. This raises important planning questions. While cities may not directly control all Scope 3 emissions, excluding them from inventories risks underestimating the true climate impact of urban economic systems. For port cities like Thoothukudi, acknowledging and accounting for these emissions is essential for designing realistic mitigation strategies that involve coordination with port authorities, logistics operators, and regional agencies.
Tamil Nadu’s State GHG Emissions Inventory and Thoothukudi’s Road Transport GHG Emissions Inventory
The overall mobility and fleet patterns show a similar trend between the state of Tamil Nadu and the city of Thoothukudi. In the base year 2024-25, passenger vehicles accounted for 96% of total registrations in Thoothukudi (versus 4% for freight), dominated by two-wheelers (79%) and cars (14%). The fleet is characterized by high petrol-based vehicle technology (82%), followed by diesel (9%), with EVs comprising 6%, CNG (1%), and hybrid vehicles (1%). In 2024-25, the passenger segment was dominated by petrol (88%) and freight segment by diesel (87%).
Similarly, Tamil Nadu, passenger vehicles comprised 96% of registrations (4% freight), primarily driven by two-wheelers (79%) and cars (13%) in 2024-25. The state fleet was dominated by petrol (80%) and diesel (8%) vehicles, with EVs comprising 7%, CNG (3%) and hybrid vehicles (1%). Passenger vehicles relied mainly on petrol (85%), and freight on diesel (86%).
At the state level, the total transport sector GHG emissions of Tamil Nadu were 27 MtCO₂e in 2019.[3] As per our assessment, Thoothukudi’s road transport GHG emissions were estimated at 0.351 MtCO₂e in 2024-25[4], approximately 1.3% of the total state-level transport sector GHG emissions. The freight sector contributed 0.21 MtCO₂e (60%) and passenger transport 0.141 MtCO₂e (40%) of the total city-level GHG emissions from the transport sector.
Thoothukudi’s per capita road transport emissions as per the two models are 0.72 tCO₂e (TERI) and 1.23 tCO₂e (Cenex), which is significantly higher than those of other midsized Tamil Nadu cities, such as Tiruchirappalli (0.24 tCO₂e)[5] and Coimbatore (0.22 tCO₂e)[5]. However, compared with cities that also host major cargo ports, such as Kochi (1.26 tCO₂e)[5] and Panaji (1.34 tCO₂e)[5] exhibit similar level of per capita transport emissions. This pattern reflects the substantial contribution of port linked freight movement, with heavy freight vehicles emerging as the dominant source of road transport emissions in port cities.
What the Baseline Enables: From Numbers to Action
A transport GHG baseline is only as valuable as its ability to inform action. For Thoothukudi, the inventory provides several critical capabilities. It establishes a reference point against which future emission-reduction efforts can be measured, enabling tracking of progress under NCAP, state climate missions, and longer-term net-zero pathways.
This helps prioritize interventions by clearly identifying high-impact segments. The dominance of freight emissions suggests that measures targeting heavy commercial vehicles, such as fleet modernization, logistics efficiency, modal shift, and cleaner fuels, are likely to yield far greater benefits than isolated actions focused solely on private passenger vehicles.
The baseline further supports scenario modelling. By understanding current activity levels, fleet composition, and fuel use, planners can assess how different strategies–electrification, scrappage policies, improved public transport, or freight consolidation–would affect future emissions.
Strategic Directions for Decarbonizing Transport in Thoothukudi
The findings from the baseline inventory point toward a set of evidence-based priorities for transport decarbonization, with a way forward as follows (Figure 5).
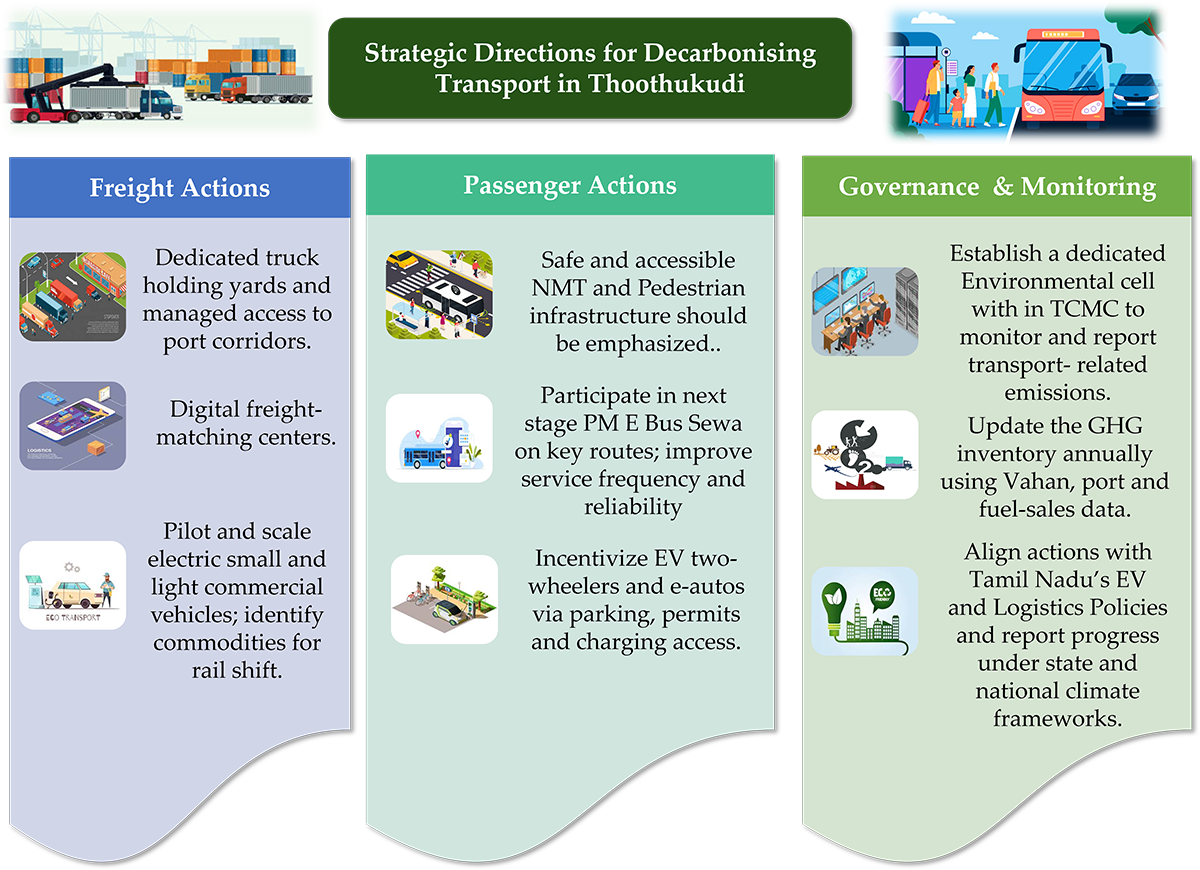
Figure 5: Findings from the baseline inventory
Freight management around the VOC Port emerges as the single most critical intervention area. Promoting cleaner and more efficient truck technologies, improving access to rail or conveyor systems where feasible, and developing dedicated freight corridors can significantly cut emissions while also reducing congestion and air pollution.
For passenger transport, the emphasis should be on avoiding a shift toward increased car dependence as incomes rise. Strengthening bus services, improving last-mile connectivity, and investing in safe walking and cycling infrastructure can help retain and grow the share of low-emission modes. Electrification of two-wheelers, three-wheelers, and public transport fleets can further reduce tailpipe emissions, provided it is supported by reliable charging infrastructure and clean electricity.
Equally important are governance and data integration. Embedding transport-emissions monitoring within municipal planning processes, linking inventories to mobility plans and budgets, and regularly updating datasets will ensure that the baseline remains a living tool rather than a one-time report.
Conclusion: Why This Baseline Matters Beyond Thoothukudi
Thoothukudi’s Road Transport GHG Emission Inventory demonstrates how rigorous, data-driven analysis can illuminate the structure of urban emissions in rapidly growing, port-linked cities. By combining primary surveys with complementary modelling approaches, the study provides a credible understanding of where emissions originate, why freight transport dominates the profile, and which policy levers hold the greatest potential for mitigation.
Beyond its local relevance, the exercise offers a replicable framework for other Tier-II cities confronting similar growth pressures, freight activity, and infrastructure constraints. Establishing robust, city-level transport emission baselines enables urban authorities to move from broad climate ambitions to targeted, evidence-based action. As India advances toward its national climate commitments, such localized inventories can empower cities to identify priority interventions, monitor progress, and design policies that align economic development with environmental responsibility.
For Thoothukudi, this inventory represents not an endpoint but a foundation, one that can guide strategic planning toward a more resilient, efficient, and climate-responsive urban mobility system. For other cities, it offers a clear message: systematic measurement is the first step toward meaningful emission reduction and sustainable urban transport transformation.
This blog post is based on the report “Thoothukudi’s Road Transport Baseline GHG Emission Inventory”, which is expected to be published later this year under the UK PACT (Partnering for Accelerated Climate Transitions) Programme. The report forms part of the PACT–Digi‑PULSE project (Partnering for Advancing Carbon‑Neutral Transitions Using Digital‑Twin‑Based Planning for Urban Living and a Sustainable Environment) for the city of Thoothukudi.
Along with TERI (Sharif Qamar, Ruchika Mattoo, Arun Babu, Shreya Gupta, and Rumi Azim), the primary contributors to the report include consortium partners from Cenex (Mr. Greg Payne and Ms. Nandini Shandilya).
References
[1] Estimation of vehicle stock in the two models: TERI’s model first applies assumptions on average vehicle lifetime (maximum years a typical vehicle in each category can operate on roads, technologically or based on policy interventions) to determine the surviving fleet for each vehicle category. It then applies category-specific utilization rates to estimate the share of vehicles operating on the road. Cenex’s model applies a scrappage model (utilizing the Vahan historical vehicle registration data) retiring a proportion of vehicles annually dependent on vehicle age and type, thus calculating the surviving number of vehicles in the city. It considers that all the surviving vehicles are in use for 313 days in a year.
[2] VOC Port Annual Reports
[4] TERI Analysis
[5] TERI Analysis based on Tamil Nadu Climate Tracker& National Institute of Urban Affairs (2023)
Partners
Cenex, IIT Madras