Page 5 - Discussion Paper: Modelling Urban Carrying Capacity and Measuring Quality of Life using System Dynamics
P. 5
Discussion Paper
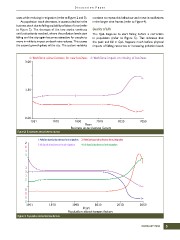
rates while reducing in-migration (refer to Figure 2 and 3). continue to repeat this behaviour and move in oscillations
As population stock decreases, it causes a decline in the in the longer time frames (refer to Figure 4).
business stock due to falling availability of labour force (refer Quality of Life
to Figure 2). The decrease of the two stocks continues
until a situation is reached, where the pollution levels start The QoL happens to start falling before a correction
falling and the city again becomes attractive for people to in population (refer to Figure 5). This indicates that
move in while its impact on death rate reduces. This causes the peak and fall in QoL happens much before physical
the second growth phase of the city. The system variables impacts of falling resources or increasing pollution levels
Figure 2: Businesses attractiveness factors
1: Pollution based attractiveness for in migration 2: Pollution based attractiveness for out migration
3: Job based attractiveness for out migration 4: Job based attractiveness for in migration
Figure 3: Population attractiveness factors
FEBRUARY 2016 5