Page 4 - Discussion Paper: Modelling Urban Carrying Capacity and Measuring Quality of Life using System Dynamics
P. 4
Discussion Paper
Environmental Pollution Sector Environmental pollution based QoL: Determined
from the pollution density ratio. QoL falls when this
This sector consists of one composite stock of increases beyond 1.
environmental pollution, which has one inflow and one
outflow. The inflow is a composite flow: a function of The Overall QoL is obtained by multiplying the above and
emissions, untreated waste water, as well as uncollected appropriately normalizing to a scale of 0 to 5 to give the
and untreated solid waste. It is a representation of the air, overall QoL, with 5 denoting the best and 0 the worst QoL.
water, and solid waste related environmental pollution.
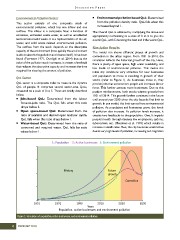
The outflow from the stock depends on the absorptive Simulation Results
capacity of the environment (how quickly the environment
is able to absorb the pollution and cleanse itself). It has been The model run shows different phases of growth and
found (Forrester 1971, Ourdighi et al. 2014) that as the correction in the urban region. From 1951 to 2014, the
value of the pollution stock increases, it creates a feedback simulation reflects the historical growth of the city. Here,
that reduces the absorptive capacity and increases the time there is plenty of open space, high water availability, and
required for cleaning the amount of pollution. low levels of environmental pollution. This makes the
initial city conditions very attractive for new businesses
QoL Sector and population to move in resulting in growth of their
stocks (refer to Figure 1). As businesses move in, they
QoL sector is a composite index to measure the dynamic provide jobs that attract more people and increases labour
QoL of people. It comprises several sector-wise QoLs, force. This further attracts more businesses. Due to this
measured on a scale of 0 to 5. These are briefly described positive reinforcement, both stocks witness growth from
below. 1951 till 2014. This growth further continues in the future
Jobs-based QoL: Determined from the labour until around year 2030 when the city faces its first limit to
growth. In our model, this limit comes from environmental
force-to-jobs ratio. The QoL falls when this ratio pollution. As population and businesses grow, the levels
drops below 1. of pollution also increase. As pollution levels increase, it
Open space-based QoL: Determined from the creates two feedbacks to the population. One, It impacts
ratio of available and desired open land per capita. people’s health through diseases like emphysema, asthma,
QoL falls when this ratio drops below 1. tuberculosis, etc. (Meadows et al. 1974) which results in
Water-based QoL: Determined from the ratio of increase in death rates. Two, the city becomes unattractive
consumed and required water. QoL falls for ratio due to very high levels of pollution, increasing out-migration
values below 1.
Figure 1: Simulation of population, active businesses, and environment pollution
4 FEBRUARY 2016
Environmental Pollution Sector Environmental pollution based QoL: Determined
from the pollution density ratio. QoL falls when this
This sector consists of one composite stock of increases beyond 1.
environmental pollution, which has one inflow and one
outflow. The inflow is a composite flow: a function of The Overall QoL is obtained by multiplying the above and
emissions, untreated waste water, as well as uncollected appropriately normalizing to a scale of 0 to 5 to give the
and untreated solid waste. It is a representation of the air, overall QoL, with 5 denoting the best and 0 the worst QoL.
water, and solid waste related environmental pollution.
The outflow from the stock depends on the absorptive Simulation Results
capacity of the environment (how quickly the environment
is able to absorb the pollution and cleanse itself). It has been The model run shows different phases of growth and
found (Forrester 1971, Ourdighi et al. 2014) that as the correction in the urban region. From 1951 to 2014, the
value of the pollution stock increases, it creates a feedback simulation reflects the historical growth of the city. Here,
that reduces the absorptive capacity and increases the time there is plenty of open space, high water availability, and
required for cleaning the amount of pollution. low levels of environmental pollution. This makes the
initial city conditions very attractive for new businesses
QoL Sector and population to move in resulting in growth of their
stocks (refer to Figure 1). As businesses move in, they
QoL sector is a composite index to measure the dynamic provide jobs that attract more people and increases labour
QoL of people. It comprises several sector-wise QoLs, force. This further attracts more businesses. Due to this
measured on a scale of 0 to 5. These are briefly described positive reinforcement, both stocks witness growth from
below. 1951 till 2014. This growth further continues in the future
Jobs-based QoL: Determined from the labour until around year 2030 when the city faces its first limit to
growth. In our model, this limit comes from environmental
force-to-jobs ratio. The QoL falls when this ratio pollution. As population and businesses grow, the levels
drops below 1. of pollution also increase. As pollution levels increase, it
Open space-based QoL: Determined from the creates two feedbacks to the population. One, It impacts
ratio of available and desired open land per capita. people’s health through diseases like emphysema, asthma,
QoL falls when this ratio drops below 1. tuberculosis, etc. (Meadows et al. 1974) which results in
Water-based QoL: Determined from the ratio of increase in death rates. Two, the city becomes unattractive
consumed and required water. QoL falls for ratio due to very high levels of pollution, increasing out-migration
values below 1.
Figure 1: Simulation of population, active businesses, and environment pollution
4 FEBRUARY 2016