Page 2 - Discussion Paper on Faecal Sludge Management in Urban India
P. 2
Discussion Paper
in a target-oriented approach in rural and Figure 2: Different types of sanitation systems in
urban India, respectively. There is an increased Urban India (2013)
recognition among the policy makers that open
defecation constitutes serious health and human Source: CETP University, PAS Project
capital crisis, and hence, achieving sustainable
ODF communities should be the foremost priority 1, shows that at all India level, 56.4% wards are
of the Government. reported to have sewer network for disposal of
liquid. This indicates that there is an incremental
In urban India, a total of 26.64 lakh improvement from around 50% sewer connection
constructions have been achieved against a as per Census 2011 data. However, most of the
target of 66.42 lakhs individual household toilets3 faecal sludge ends up in the environment, and
which is equivalent to 3500 urban toilets being only 19% of faecal matter is safely disposed due
constructed on a daily basis. The rate of growth of to lack of proper FSM (Figure 3).
coverage of household toilets is unprecedented,
and as per the annual target plan of SBM (Urban), Table 1: Sewer network coverage in Indian
this momentum is going to continue further,4 states
as depicted in Figure 1, because of the high political
will towards achieving ODF communities. Percentage of Number Percentage
Sewer Network of States of population
The Census of India reveals that about 41%
of the urban households use on-site sanitation <20% 5 3.44
systems (OSSs) such as septic tanks, pit latrines.
The Twelfth Five Year (2012–17) Planning 20–50% 8 32.64
Commission Report on Urban Development also
highlights that 4861 cities and towns in India lack 50–70% 6 37.55
even a partial sewerage network and almost 50%
of households in cities such as Bangalore and 70–90% 5 19.29
Hyderabad do not have sewerage connections.5
>90 % 2 6.38
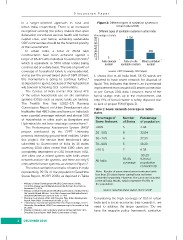
The Performance Assessment System (PAS)6
project conducted by the CEPT University All India 56.4% 99.29
presents interesting ground-level realities. Under coverage % (total
this project, the service level benchmark data population
submitted to Government of India by 16 states considered)
covering 1564 cities reveal that 1190 cities are
completely dependent on OSS (more than 70%), Note: Results of some states/union territories (with
369 cities use a mixed system with both sewer less than 20 urban frame survey) have not been
network and on-site systems, and there are only 5 presented separately. However, the same are included
cities with full sewer systems, as shown in Figure 2. in the all India results, which represent 99.29% of
the population.
The urban sanitation scenario of states in India
representing 99.3% of the population (Swachhta Source: Swachhta Status Report, MOSPI 20167
Status Report, MOSPI 2016), as depicted in Table
Considering the high coverage of OSS in urban
3 Ministry of Urban Development (MoUD), Government of India, India and a socio-economic bias towards it, we
From http://www.swachhbharaturban.in/sbm/home/, Accessed on need to address the larger question: “Do we
November 19, 2016. have the requisite policy framework, sanitation
4 Ministry of Urban Development (MoUD), Government of India, RFD for
the Swachh Bharat Mission, From http://www.swachhbharaturban.in/
sbm/home/#/SBM, Accessed on June 17, 2016.
5 Planning Commission, 2012. 12th Five year Plan, Urban Development
Report. New Delhi: Government of India; p. 321.
6 Performance Assessment System (PAS). PAS Project Findings of CEPT
University, Ahmedabad, 2012. From www.pas.org.in, Accessed on July
18, 2016.
7 Ministry of Statistics and Programme Implementation (MOSPI), 2016.
Swachhta Status Report. New Delhi: Government of India.
2 DECEMBER 2016
in a target-oriented approach in rural and Figure 2: Different types of sanitation systems in
urban India, respectively. There is an increased Urban India (2013)
recognition among the policy makers that open
defecation constitutes serious health and human Source: CETP University, PAS Project
capital crisis, and hence, achieving sustainable
ODF communities should be the foremost priority 1, shows that at all India level, 56.4% wards are
of the Government. reported to have sewer network for disposal of
liquid. This indicates that there is an incremental
In urban India, a total of 26.64 lakh improvement from around 50% sewer connection
constructions have been achieved against a as per Census 2011 data. However, most of the
target of 66.42 lakhs individual household toilets3 faecal sludge ends up in the environment, and
which is equivalent to 3500 urban toilets being only 19% of faecal matter is safely disposed due
constructed on a daily basis. The rate of growth of to lack of proper FSM (Figure 3).
coverage of household toilets is unprecedented,
and as per the annual target plan of SBM (Urban), Table 1: Sewer network coverage in Indian
this momentum is going to continue further,4 states
as depicted in Figure 1, because of the high political
will towards achieving ODF communities. Percentage of Number Percentage
Sewer Network of States of population
The Census of India reveals that about 41%
of the urban households use on-site sanitation <20% 5 3.44
systems (OSSs) such as septic tanks, pit latrines.
The Twelfth Five Year (2012–17) Planning 20–50% 8 32.64
Commission Report on Urban Development also
highlights that 4861 cities and towns in India lack 50–70% 6 37.55
even a partial sewerage network and almost 50%
of households in cities such as Bangalore and 70–90% 5 19.29
Hyderabad do not have sewerage connections.5
>90 % 2 6.38
The Performance Assessment System (PAS)6
project conducted by the CEPT University All India 56.4% 99.29
presents interesting ground-level realities. Under coverage % (total
this project, the service level benchmark data population
submitted to Government of India by 16 states considered)
covering 1564 cities reveal that 1190 cities are
completely dependent on OSS (more than 70%), Note: Results of some states/union territories (with
369 cities use a mixed system with both sewer less than 20 urban frame survey) have not been
network and on-site systems, and there are only 5 presented separately. However, the same are included
cities with full sewer systems, as shown in Figure 2. in the all India results, which represent 99.29% of
the population.
The urban sanitation scenario of states in India
representing 99.3% of the population (Swachhta Source: Swachhta Status Report, MOSPI 20167
Status Report, MOSPI 2016), as depicted in Table
Considering the high coverage of OSS in urban
3 Ministry of Urban Development (MoUD), Government of India, India and a socio-economic bias towards it, we
From http://www.swachhbharaturban.in/sbm/home/, Accessed on need to address the larger question: “Do we
November 19, 2016. have the requisite policy framework, sanitation
4 Ministry of Urban Development (MoUD), Government of India, RFD for
the Swachh Bharat Mission, From http://www.swachhbharaturban.in/
sbm/home/#/SBM, Accessed on June 17, 2016.
5 Planning Commission, 2012. 12th Five year Plan, Urban Development
Report. New Delhi: Government of India; p. 321.
6 Performance Assessment System (PAS). PAS Project Findings of CEPT
University, Ahmedabad, 2012. From www.pas.org.in, Accessed on July
18, 2016.
7 Ministry of Statistics and Programme Implementation (MOSPI), 2016.
Swachhta Status Report. New Delhi: Government of India.
2 DECEMBER 2016