Page 22 - Transitions in Indian Electricity Sector- A Report by TERI
P. 22
TRANSITIONS IN INDIAN E LECTRICITY SECTOR 2017–2030
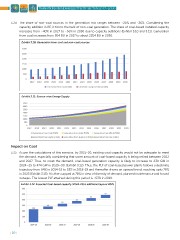
3.24 The share of non-coal sources in the generation mix ranges between ~20% and ~26%. Considering the
capacity addition in RE, it forms the bulk of non-coal generation. The share of coal-based installed capacity
increases from ~40% in 2027 to ~56% in 2030 due to capacity additions (Exhibit 3.10 and 3.11). Generation
from coal increases from 954 BU in 2017 to about 2354 BU in 2030.
Exhibit 3.10: Generation from coal and non-coal sources
3000
2500
2000
1500
1000
500
0
2017 2018 2019 2020 2021 2022 2023 2024 2025 2026 2027 2028 2029 2030
Generation from coal (TWh) Total Non Coal generation (TWh)
Exhibit 3.11: Source-wise Energy Supply
3500 2018 2019 2020 2021 2022 2023 2024 2025 2026 2027 2028 2029 2030
3000
2500
2000
1500
1000
500
0
2017
Generation from Coal (TWh) Generation from Solar (TWh) Generation from Wind (TWh)
Generation from Hydro (TWh) Generation from Nuclear (TWh) Generation from Gas (TWh)
Impact on Coal
3.25 As per the calculations of this exercise, by 2025-26, existing coal capacity would not be adequate to meet
the demand, especially considering that some amount of coal-based capacity is being retired between 2022
and 2027. Thus, to meet the demand, coal-based generation capacity is likely to increase to 230 GW in
2024–25 to 474 GW in 2029–30. (Exhibit 3.12). Thus, the PLF of coal-based power plants follows a declining
trajectory from 64% in 2014-15 to 53% in 2018-19 and thereafter shows an upward trend, reaching upto 78%
in 2025 (Exhibit 3.13). It is then capped at 78% in view of diversity of demand, planned maintenance and forced
outages. The lowest PLF attained during this period is ~53% in 2019.
Exhibit 3.12: Expected Coal-based capacity (2024-25) & additions beyond 2025
| 22 |