Page 11 - Transitions in Indian Electricity Sector- A Report by TERI
P. 11
TRANSITIONS IN INDIAN E LECTRICITY SECTOR 2017–2030
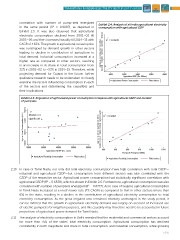
correlation with number of pump-sets energized Agriculture Consumption (MU)Exhibit 2.4: Analysis of all India agricultural electricity
in the same period (R2 = 0.9087), as depicted in 80000 100000 120000 140000 160000consumption with agricultural GDP
Exhibit 2.5. It was also observed that agricultural
electricity consumption declined from 2001–02 till R2 = 0.9345
2005–06 and then increased steadily till 2014–15 with
CAGR of 4.62%. The growth in agricultural consumption 4500 5000 5500 6000 6500
was outstripped by demand growth in other sectors Agricultural GDP (Rs. Billion)
leading to decline in contribution of agriculture to
total demand. Industrial consumption increased at a Agricultural Power Consumption Fitted values
higher rate as compared to other sectors, resulting
in an increase in its share in total consumption from
32% in 2001–02 to ~53% in 2014–15. Therefore, while
projecting demand for Gujarat in the future, further
qualitative research needs to be undertaken to closely
examine the factors influencing consumption in each
of the sectors and determining the causalities and
their implications.
Exhibit 2.5: Regression of agricultural power consumption in Gujarat with agricultural GSDP and number
of pumpsets
Agriculture Consumption (MU) 16000 Agricultural Consumption (MU)
10000 11000 12000 13000 14000 15000
Model not R2 = 0.9087
significant
14000
12000
10000
20000 30000 40000 50000 60000 800 850 900 950 1000 1050
Pumpsets Energised ('000)
Agricultural GSDP (Rs. crore)
Agriculture Electricity Consumption Fitted values Agriculture Electricity Consumption Fitted values
2.10 In case of Tamil Nadu, not only did total electricity consumption have high correlation with total GSDP—
industrial and agricultural GSDP—but consumption from different sectors was also correlated with the
GSDP of the respective sector. Agricultural power consumption had statistically significant correlation with
agricultural GSDP (R2 = 0.6838), which is shown in Exhibit 2.6. Furthermore, agricultural consumption was also
correlated with number of pumpsets energized (R2 = 0.6777). As in case of Gujarat, agricultural consumption
in Tamil Nadu increased at a much lower rate (2% CAGR) as compared to that in other sectors (more than
6%) in the state, resulting in a decline in the contribution of agricultural electricity consumption to total
electricity consumption. As the gross irrigated area remained relatively unchanged in the study period, it
can be inferred that the growth in agricultural electricity demand was largely on account of increased use
of electric pumpsets for irrigation purposes, and this causality may therefore need to be accounted in future
projections of agricultural power demand for Tamil Nadu.
2.11 The analysis of electricity consumption in Delhi revealed that the residential and commercial sectors account
for more than 75% of the states’ total electricity consumption. Agricultural consumption has declined
consistently in both magnitude and share in total consumption, and industrial consumption, while growing
| 11 |