Page 27 - Technical Document: Modelling Urban Carrying Capacity and Measuring Quality of Life using System Dynamics
P. 27
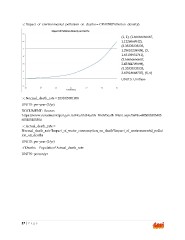
: c Impact_of_environmental_pollution_on_deaths = GRAPH(Pollution_density)
(1, 1), (1.66666666667,
1.1228668942),
(2.33333333333,
1.29010238908), (3,
1.63139931741),
(3.66666666667,
2.43344709898),
(4.33333333333,
3.67918088737), (5, 6)
UNITS: Unitless
: c Normal_death_rate = 20310/5051908
UNITS: per year (1/yr)
DOCUMENT: Source:
https://www.suratmunicipal.gov.in/Health/Health_BirthDeath_Main.aspx?SrNo=805005305405
605405405504
: c Actual_death_rate =
Normal_death_rate*Impact_of_water_consumption_on_death*Impact_of_environmental_pollut
ion_on_deaths
UNITS: per year (1/yr)
: f Deaths = Population*Actual_death_rate
UNITS: person/yr
27 | P a g e