Page 1 - Charging Power - Understanding Electricity Pricing and the Willingness to Pay for Electricity in India
P. 1
POLICY BRIEFTERI Policy Br ief FEBRUARY 2017
The Energy and Resources Institute
Charging Power
Understanding Electricity Pricing and the
Willingness to Pay for Electricity in India
To provide useful recommendations for future electricity-pricing
debates, this project undertook a comprehensive literature review
and interviews to examine and quantify the existing evidence on the
Willingness to Pay (WTP) for electricity services in India. It compared
these findings with the current electricity-pricing mechanisms to derive
recommendations on future electricity pricing and subsidy policies.
Authors Research Findings
Bigsna Gill, Associate Fellow, TERI
E-mail: bigsna.gill@teri.res.in For rural household consumers, the defining factor for a higher (or lower)
rate of willingness to pay was the share of disposable income assigned
Sonakshi Saluja, Research Associate, TERI to electricity as a service in the overall household income. Based on
Email : sonakshi.saluja@teri.res.in the surveys examined, the average calculated monthly income of rural
households was `6,700. The expenditure on lighting was approximately 3%
Debajit Palit, Associate Director, TERI (`200 a month) of the income. Further, rural households with unreliable or
E-mail: debajitp@teri.res.in no electricity supply also bore an average ‘coping cost’ of `119 per month for
kerosene, paraffin candles, etc.
This study was conducted with
support from the Department Based on the review, most consumers expressed a high willingness to pay
for International Development, for basic lighting services. This data was primarily for stand-alone, off-grid
Government of the UK. solutions where alternatives did not exist. The willingness to pay was found
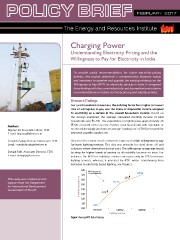
to drop for higher levels of service as affordability became an issue. For
instance, the WTP for Lighting+ services increases only by 12% from basic
lighting services, whereas, it increases by 43% when transitioning from
kerosene to electricity based lighting, see Figure 1.
WTP decreases
as costs increase
Monthly Expenditure 12%
43%
Lighting Source
Figure 1 Average WTP: Rate of Increase
The Energy and Resources Institute
Charging Power
Understanding Electricity Pricing and the
Willingness to Pay for Electricity in India
To provide useful recommendations for future electricity-pricing
debates, this project undertook a comprehensive literature review
and interviews to examine and quantify the existing evidence on the
Willingness to Pay (WTP) for electricity services in India. It compared
these findings with the current electricity-pricing mechanisms to derive
recommendations on future electricity pricing and subsidy policies.
Authors Research Findings
Bigsna Gill, Associate Fellow, TERI
E-mail: bigsna.gill@teri.res.in For rural household consumers, the defining factor for a higher (or lower)
rate of willingness to pay was the share of disposable income assigned
Sonakshi Saluja, Research Associate, TERI to electricity as a service in the overall household income. Based on
Email : sonakshi.saluja@teri.res.in the surveys examined, the average calculated monthly income of rural
households was `6,700. The expenditure on lighting was approximately 3%
Debajit Palit, Associate Director, TERI (`200 a month) of the income. Further, rural households with unreliable or
E-mail: debajitp@teri.res.in no electricity supply also bore an average ‘coping cost’ of `119 per month for
kerosene, paraffin candles, etc.
This study was conducted with
support from the Department Based on the review, most consumers expressed a high willingness to pay
for International Development, for basic lighting services. This data was primarily for stand-alone, off-grid
Government of the UK. solutions where alternatives did not exist. The willingness to pay was found
to drop for higher levels of service as affordability became an issue. For
instance, the WTP for Lighting+ services increases only by 12% from basic
lighting services, whereas, it increases by 43% when transitioning from
kerosene to electricity based lighting, see Figure 1.
WTP decreases
as costs increase
Monthly Expenditure 12%
43%
Lighting Source
Figure 1 Average WTP: Rate of Increase