Page 13 - Breathing Cleaner Air - Ten Scalable Solutions for Indian Cities
P. 13
9 Clean Air Mission for India - Ten Solutions
The other two recent studies for Delhi (Marrapu et al., respectively). The transport sector contributes about 9%,
2014; IITK, 2015) also arrived at similar findings regarding while power plants and DG (diesel generators) contribute
significant contributions from outside of the city to local about 10% to PM2.5 concentrations. Open burning of
Delhi pollution. For example, the joint study by IITM, and agricultural residue is more prevalent in the north-
University of Iowa (Marrapu et al., 2014) showed that western part of the IGP and varies seasonally. December
outside sources contributed 30–80% to air pollution in is one of the months when burning takes place, and this
different parts of Delhi. IITK (2015) also showed significant burning contributes heavily—approximately 26%—to
contributions (~56%) from secondary particulates and PM2.5 concentrations in Uttar Pradesh. Figure 3 shows
biomass burning, which mainly originate from regions primary emissions of PM2.5 in Uttar Pradesh, highlighting
outside Delhi. The simulations conducted as part of this a distinct rural-urban contrast with Delhi and India. With
task force report reproduce the percentage share of
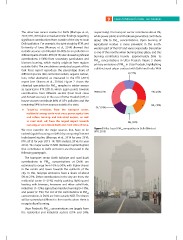
different species (like elemental carbon, organic carbon, EC (11%)
ions, other elements) as measured in the IITK (2015)
report (see Sharma et al., 2016a). Figure 2 shows the Others (27%) ORG (22%)
chemical speciation for PM2.5 samples in winter season SO4–2 (14%) NO3– (15%)
as reported in IITK (2015), which again points towards
contributions from different sectors (from both close NH4– (11%)
and distant sources). In the case of Uttar Pradesh (UP), in
house sources contribute 46% of UP’s pollution and the Figure 2 Filter-based PM2.5 composition in Delhi (Winters)
remaining 54% is from sources outside the state. (IITK, 2015)
Targeting emissions from the transport sector,
residential energy use in rural areas, power, agriculture
and refuse burning and industrial sectors, as well
as road dust, will have the largest impact towards
reducing air pollution in Delhi and most cities of India.
We next examine the major sources that have to be
curbed (again focussing on Delhi) by comparing 3 recent
India-based studies [Marrapu et al., 2014 for year 2010;
IITK, 2015 for year 2013–14; TERI analysis, 2016, for year
2015]. The major sector in NCR (National Capital Region)
that contributes to Delhi emissions are discussed in the
following paragraph.
The transport sector (both tail-pipe and road dust)
contributions to PM2.5 concentrations at Delhi are
estimated to range from 10% to 50%, with higher shares
in the centre and lower towards the outskirts of the
city. In this, tail-pipe emissions have a share of about
5% to 21%. Other contributions in the city are from, the
residential sector (7–21%), mainly cooking, lighting and
heating with biomass, kerosene and other solid fuels,
industries (1–13%), agricultural residue burning (5–13%),
and power (2–5%). The rest of the contributions to PM2.5
concentrations in Delhi are from outside NCR. The shares
will be somewhat different in the months when there is
no agricultural burning.
Uttar Pradesh’s PM2.5 concentrations are largely from
the residential and industrial sectors (21% and 24%,
The other two recent studies for Delhi (Marrapu et al., respectively). The transport sector contributes about 9%,
2014; IITK, 2015) also arrived at similar findings regarding while power plants and DG (diesel generators) contribute
significant contributions from outside of the city to local about 10% to PM2.5 concentrations. Open burning of
Delhi pollution. For example, the joint study by IITM, and agricultural residue is more prevalent in the north-
University of Iowa (Marrapu et al., 2014) showed that western part of the IGP and varies seasonally. December
outside sources contributed 30–80% to air pollution in is one of the months when burning takes place, and this
different parts of Delhi. IITK (2015) also showed significant burning contributes heavily—approximately 26%—to
contributions (~56%) from secondary particulates and PM2.5 concentrations in Uttar Pradesh. Figure 3 shows
biomass burning, which mainly originate from regions primary emissions of PM2.5 in Uttar Pradesh, highlighting
outside Delhi. The simulations conducted as part of this a distinct rural-urban contrast with Delhi and India. With
task force report reproduce the percentage share of
different species (like elemental carbon, organic carbon, EC (11%)
ions, other elements) as measured in the IITK (2015)
report (see Sharma et al., 2016a). Figure 2 shows the Others (27%) ORG (22%)
chemical speciation for PM2.5 samples in winter season SO4–2 (14%) NO3– (15%)
as reported in IITK (2015), which again points towards
contributions from different sectors (from both close NH4– (11%)
and distant sources). In the case of Uttar Pradesh (UP), in
house sources contribute 46% of UP’s pollution and the Figure 2 Filter-based PM2.5 composition in Delhi (Winters)
remaining 54% is from sources outside the state. (IITK, 2015)
Targeting emissions from the transport sector,
residential energy use in rural areas, power, agriculture
and refuse burning and industrial sectors, as well
as road dust, will have the largest impact towards
reducing air pollution in Delhi and most cities of India.
We next examine the major sources that have to be
curbed (again focussing on Delhi) by comparing 3 recent
India-based studies [Marrapu et al., 2014 for year 2010;
IITK, 2015 for year 2013–14; TERI analysis, 2016, for year
2015]. The major sector in NCR (National Capital Region)
that contributes to Delhi emissions are discussed in the
following paragraph.
The transport sector (both tail-pipe and road dust)
contributions to PM2.5 concentrations at Delhi are
estimated to range from 10% to 50%, with higher shares
in the centre and lower towards the outskirts of the
city. In this, tail-pipe emissions have a share of about
5% to 21%. Other contributions in the city are from, the
residential sector (7–21%), mainly cooking, lighting and
heating with biomass, kerosene and other solid fuels,
industries (1–13%), agricultural residue burning (5–13%),
and power (2–5%). The rest of the contributions to PM2.5
concentrations in Delhi are from outside NCR. The shares
will be somewhat different in the months when there is
no agricultural burning.
Uttar Pradesh’s PM2.5 concentrations are largely from
the residential and industrial sectors (21% and 24%,